$BTC 【Bitcoin has closed five consecutive red weekly candles, breaking below key support at 75,000. What should we watch next?】
Bitcoin is trading at 74,300+.
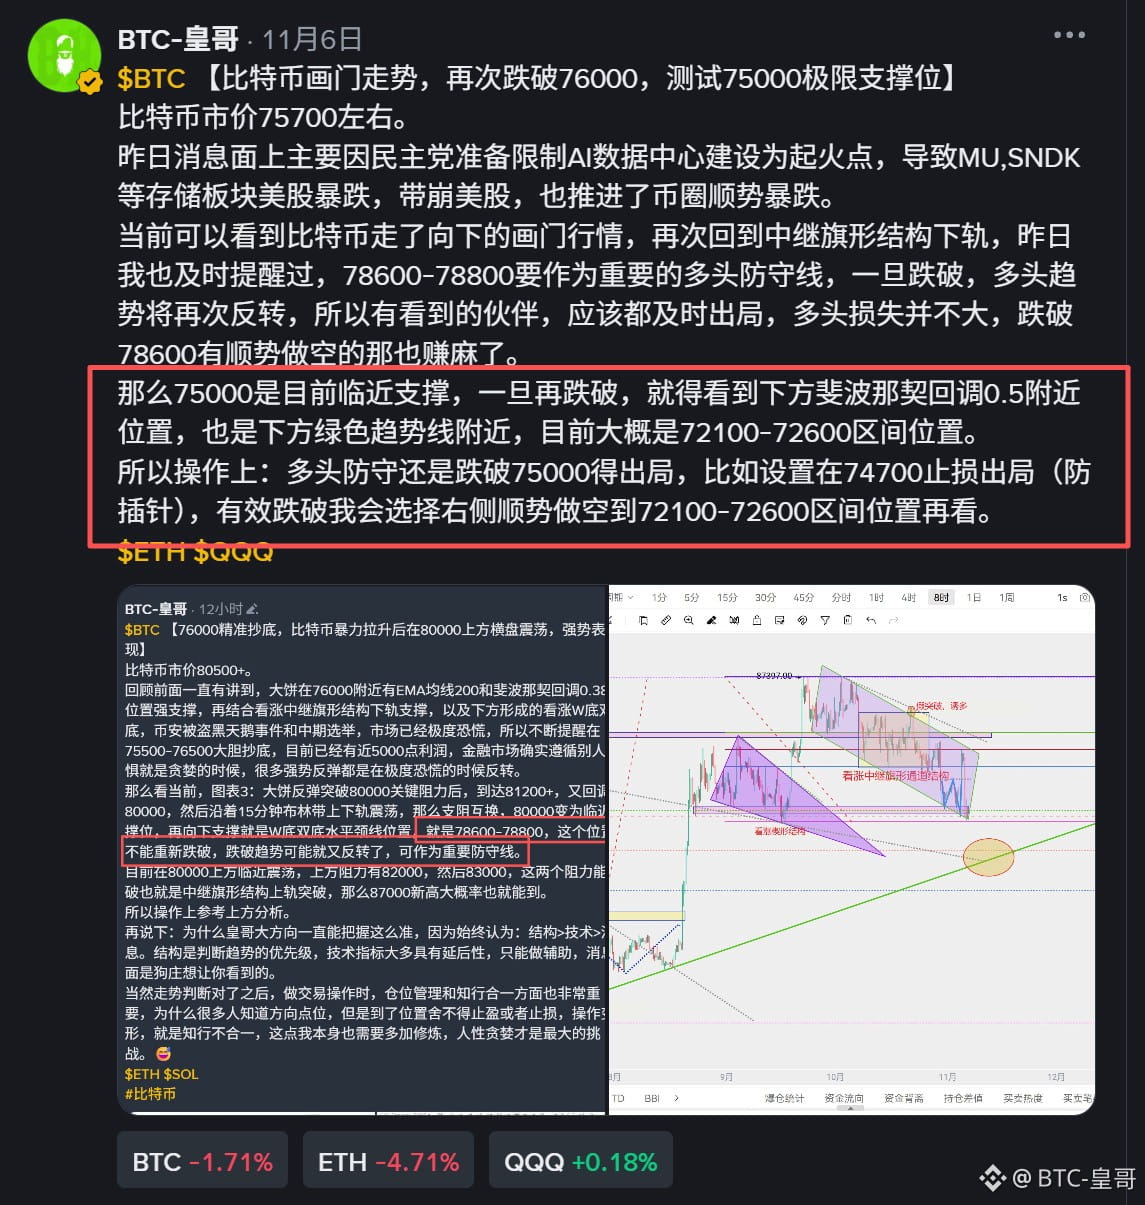
Bitcoin has been tracking the U.S. stock market fairly closely lately. As I’ve been reminding you over the past few days, if you’re holding long positions, make sure you have a defense plan. You could set 74,700 as your exit point; if price moves that way, I’ll look to short from the right-hand side down to 72,100–72,600.
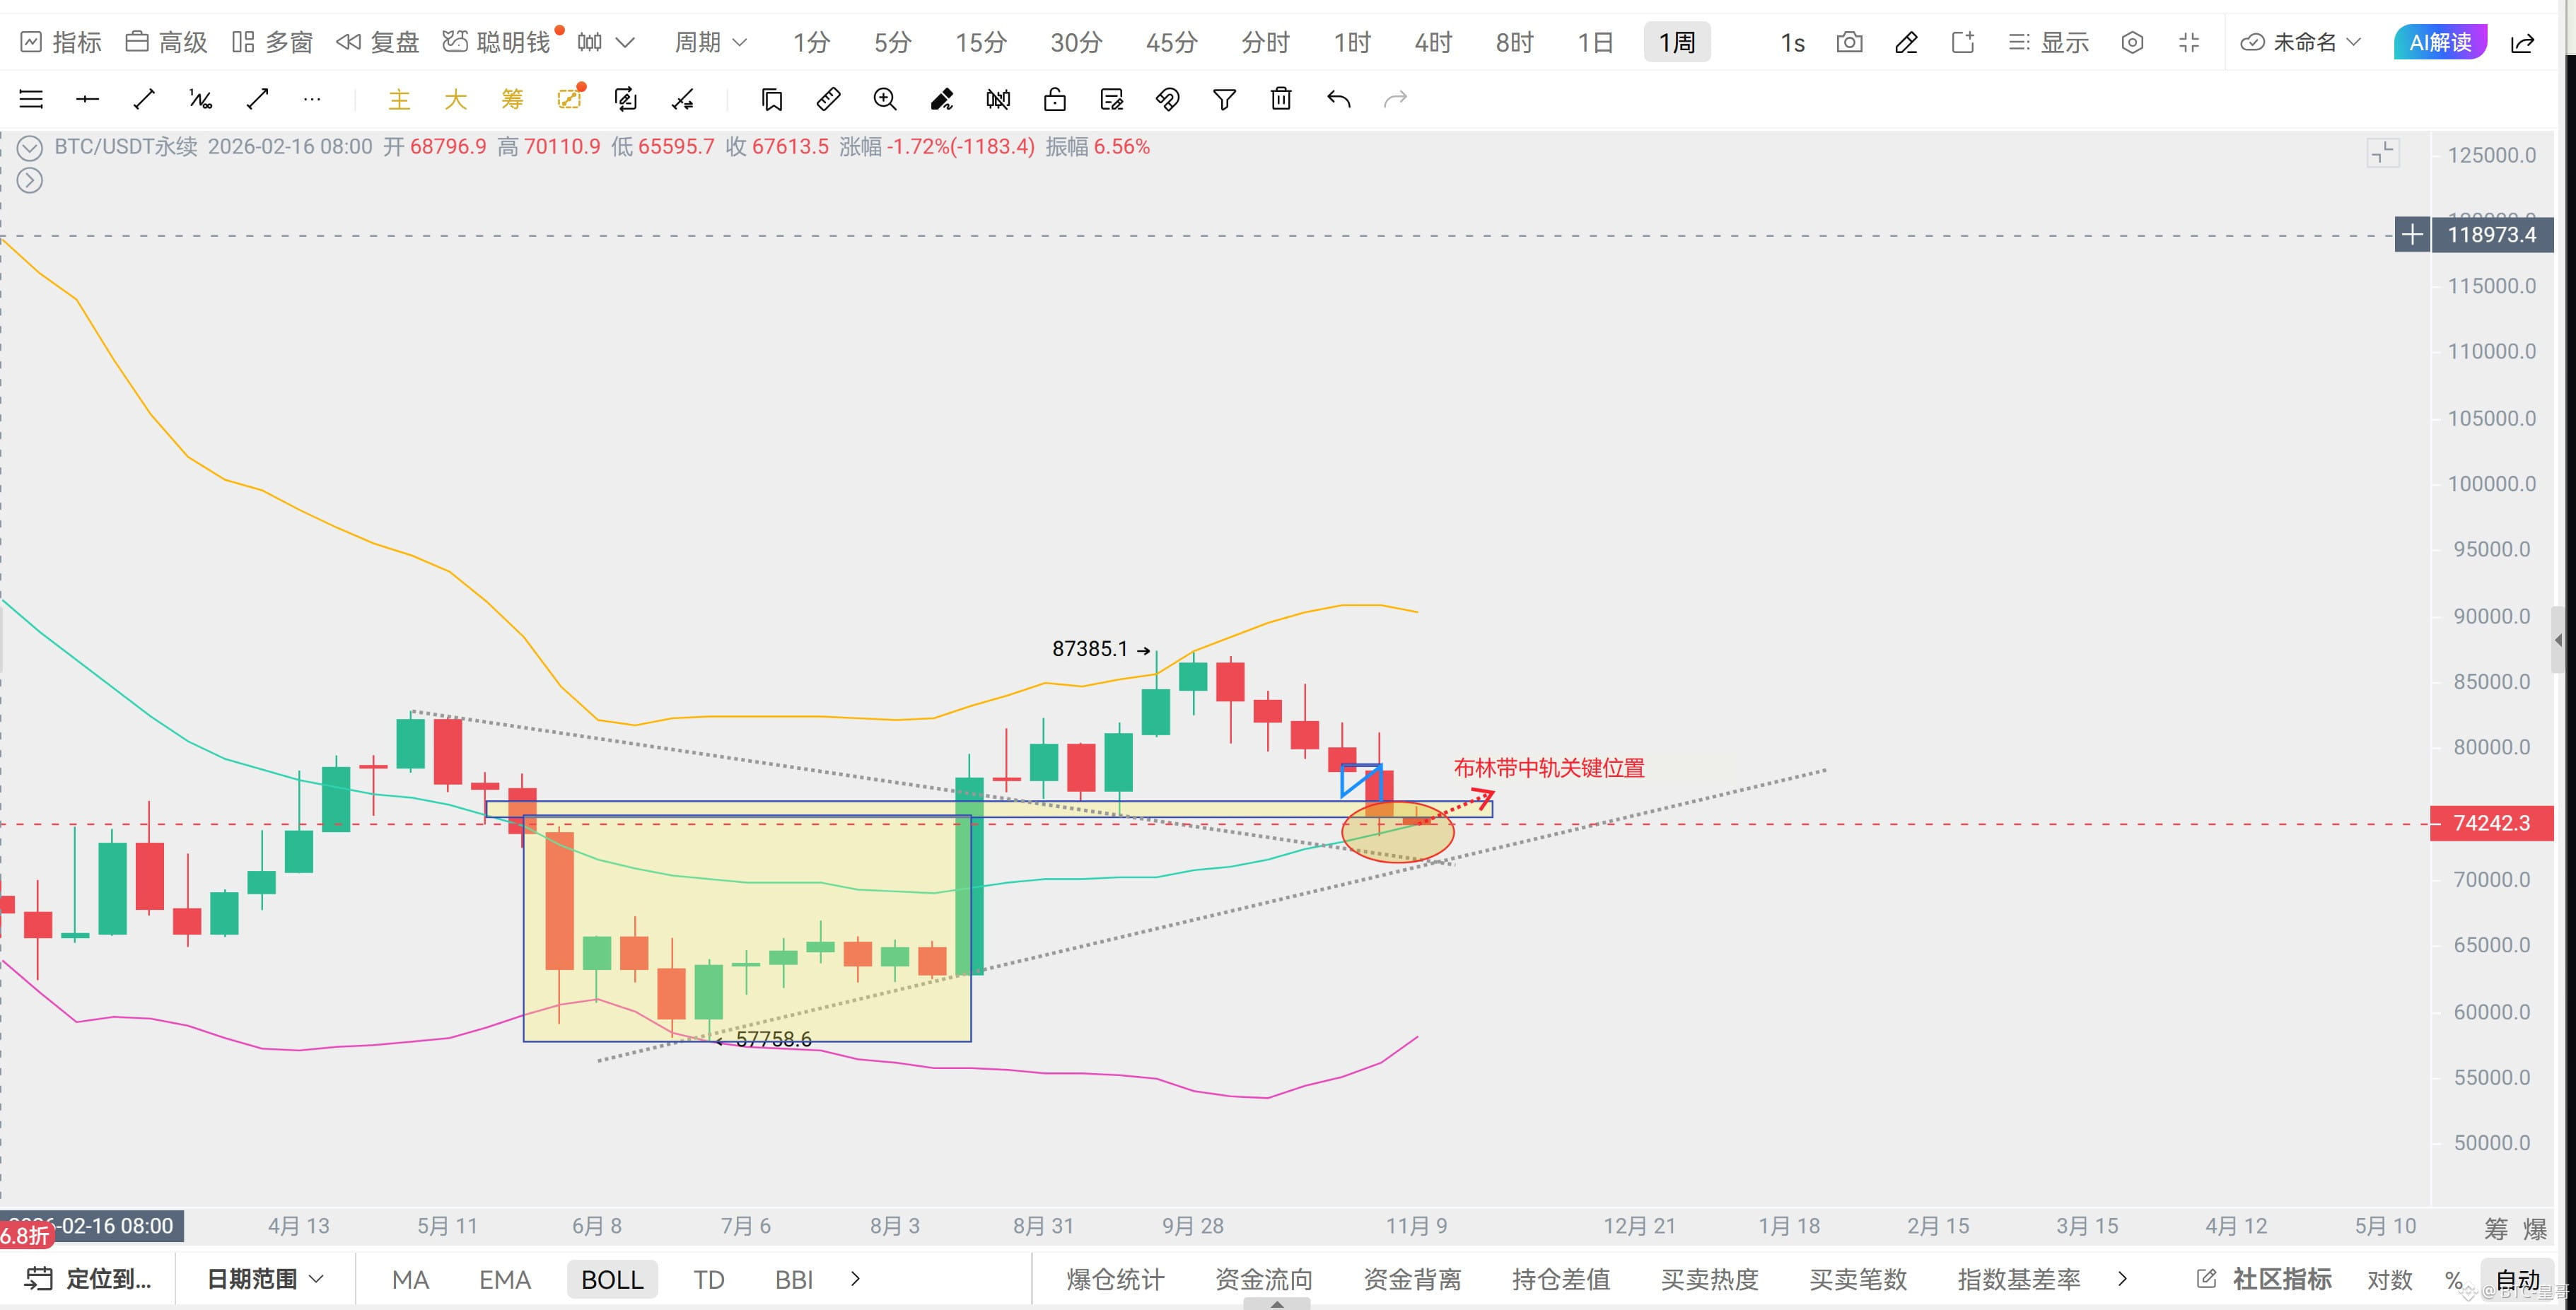
The weekly candle closes today, still marking five consecutive red candles. Fortunately, trading volume has been low. The weekly price is also currently at the Bollinger Band middle line, so this week’s close is crucial. If it closes above the middle line by Monday morning, the broader bullish trend may continue. If it closes below, things could get dangerous.
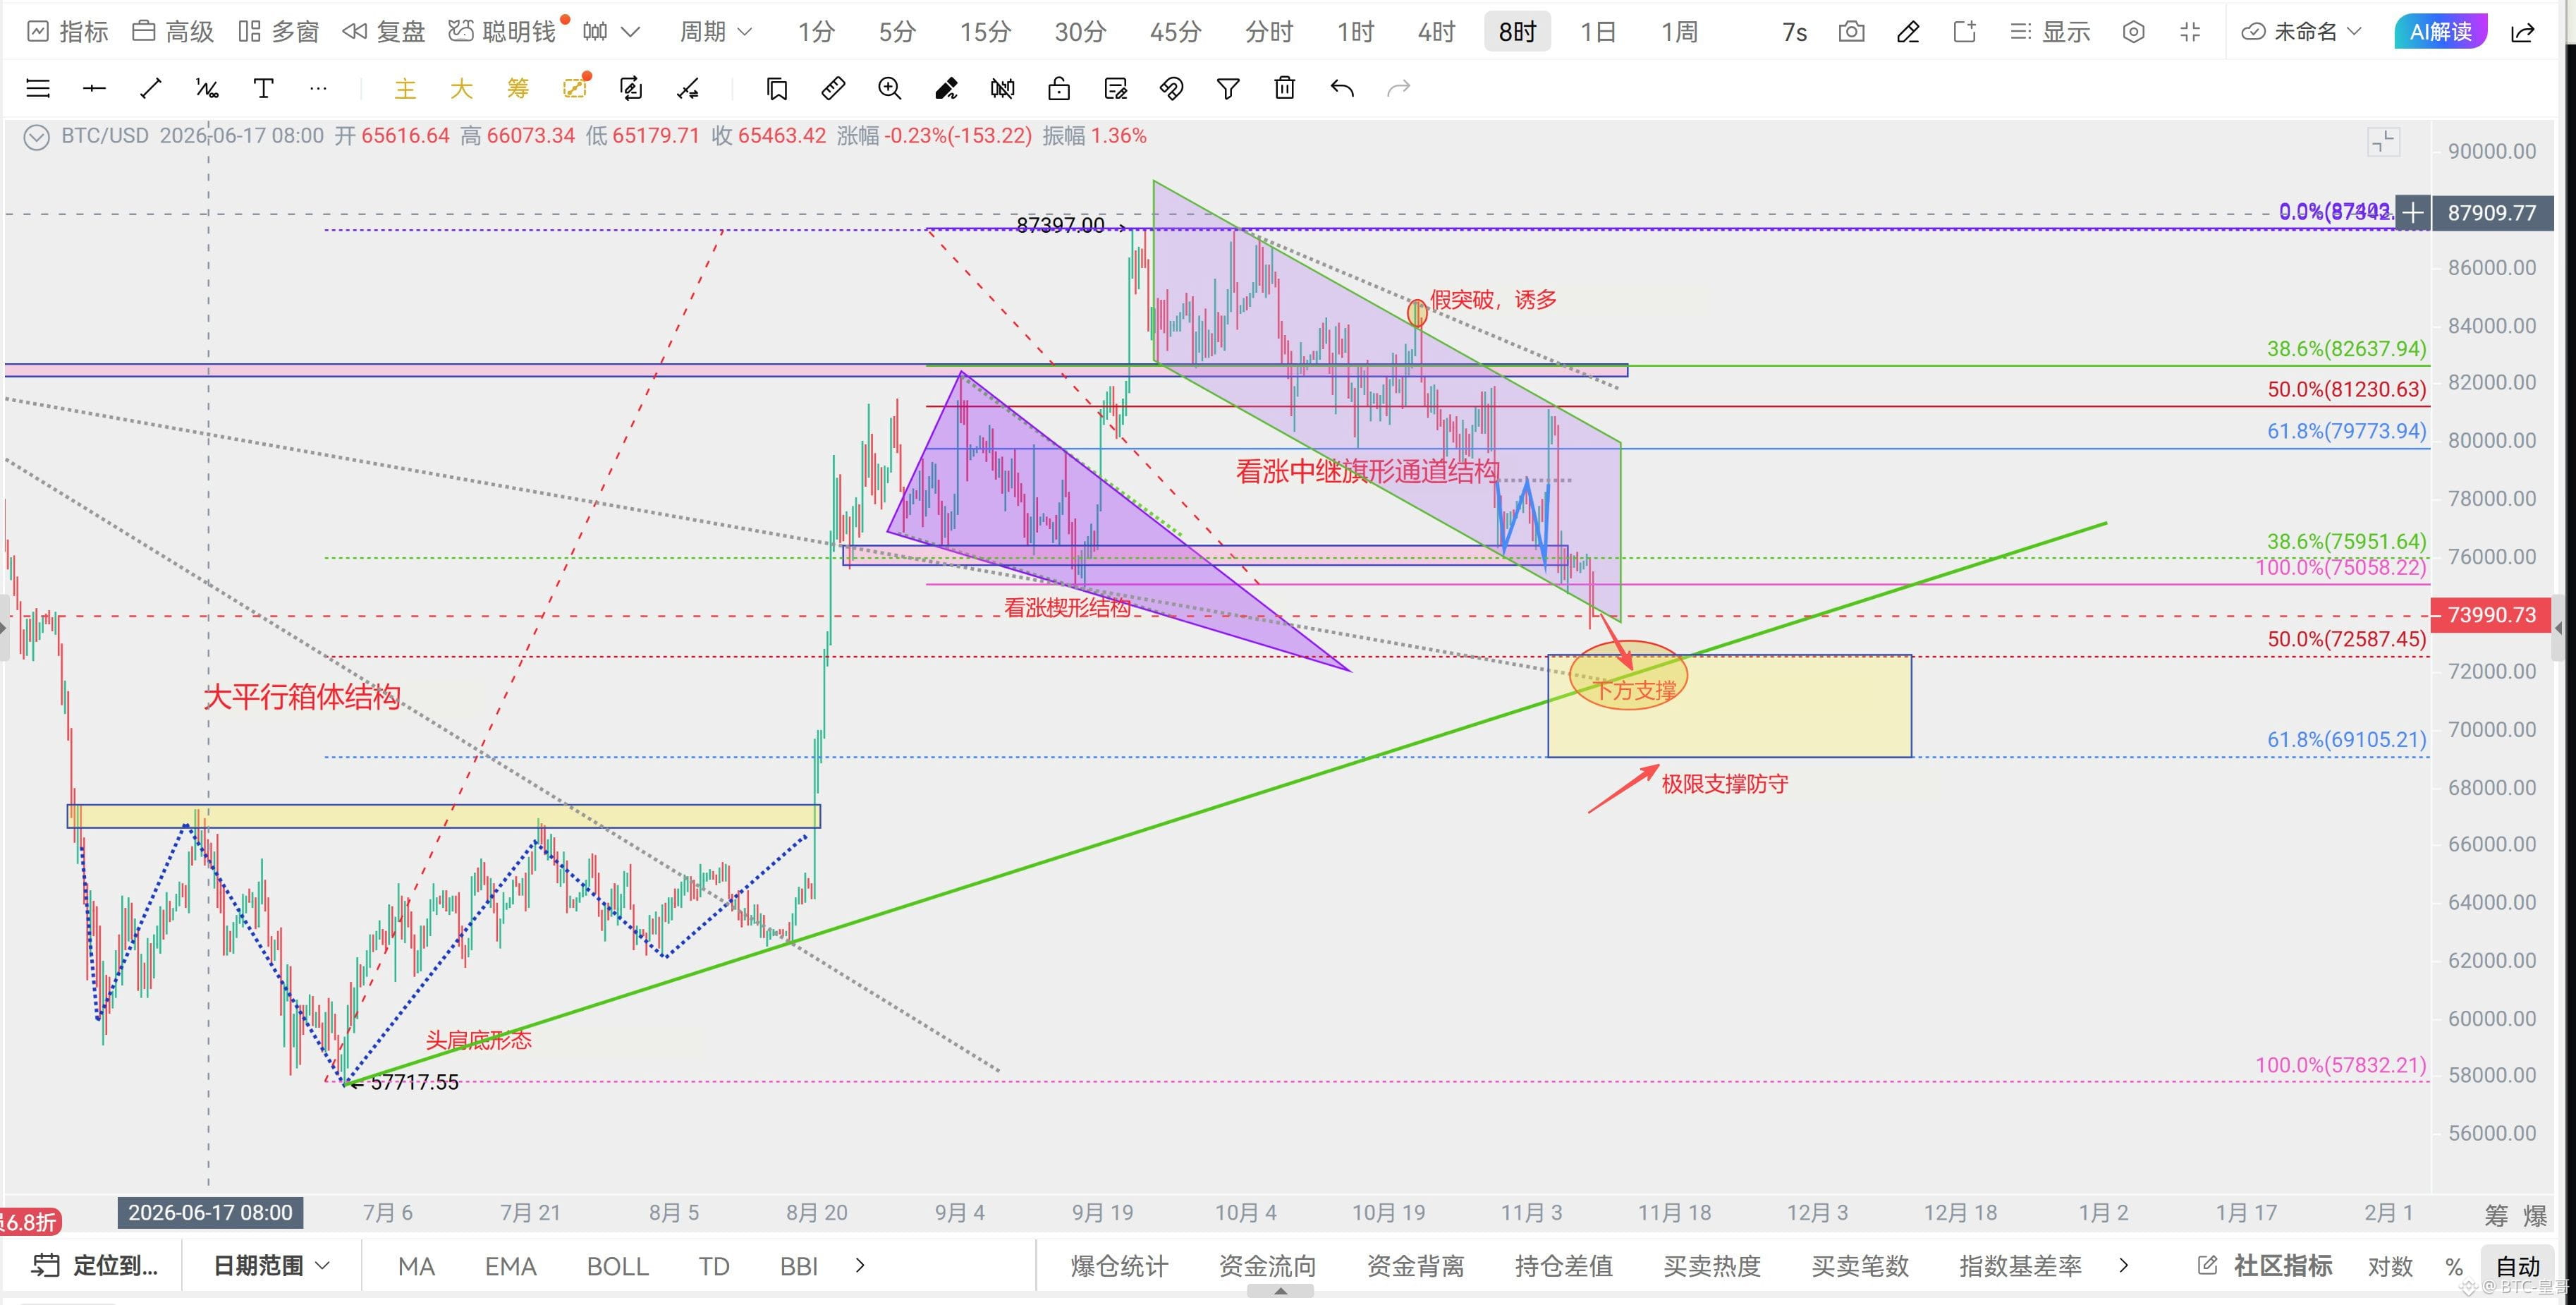
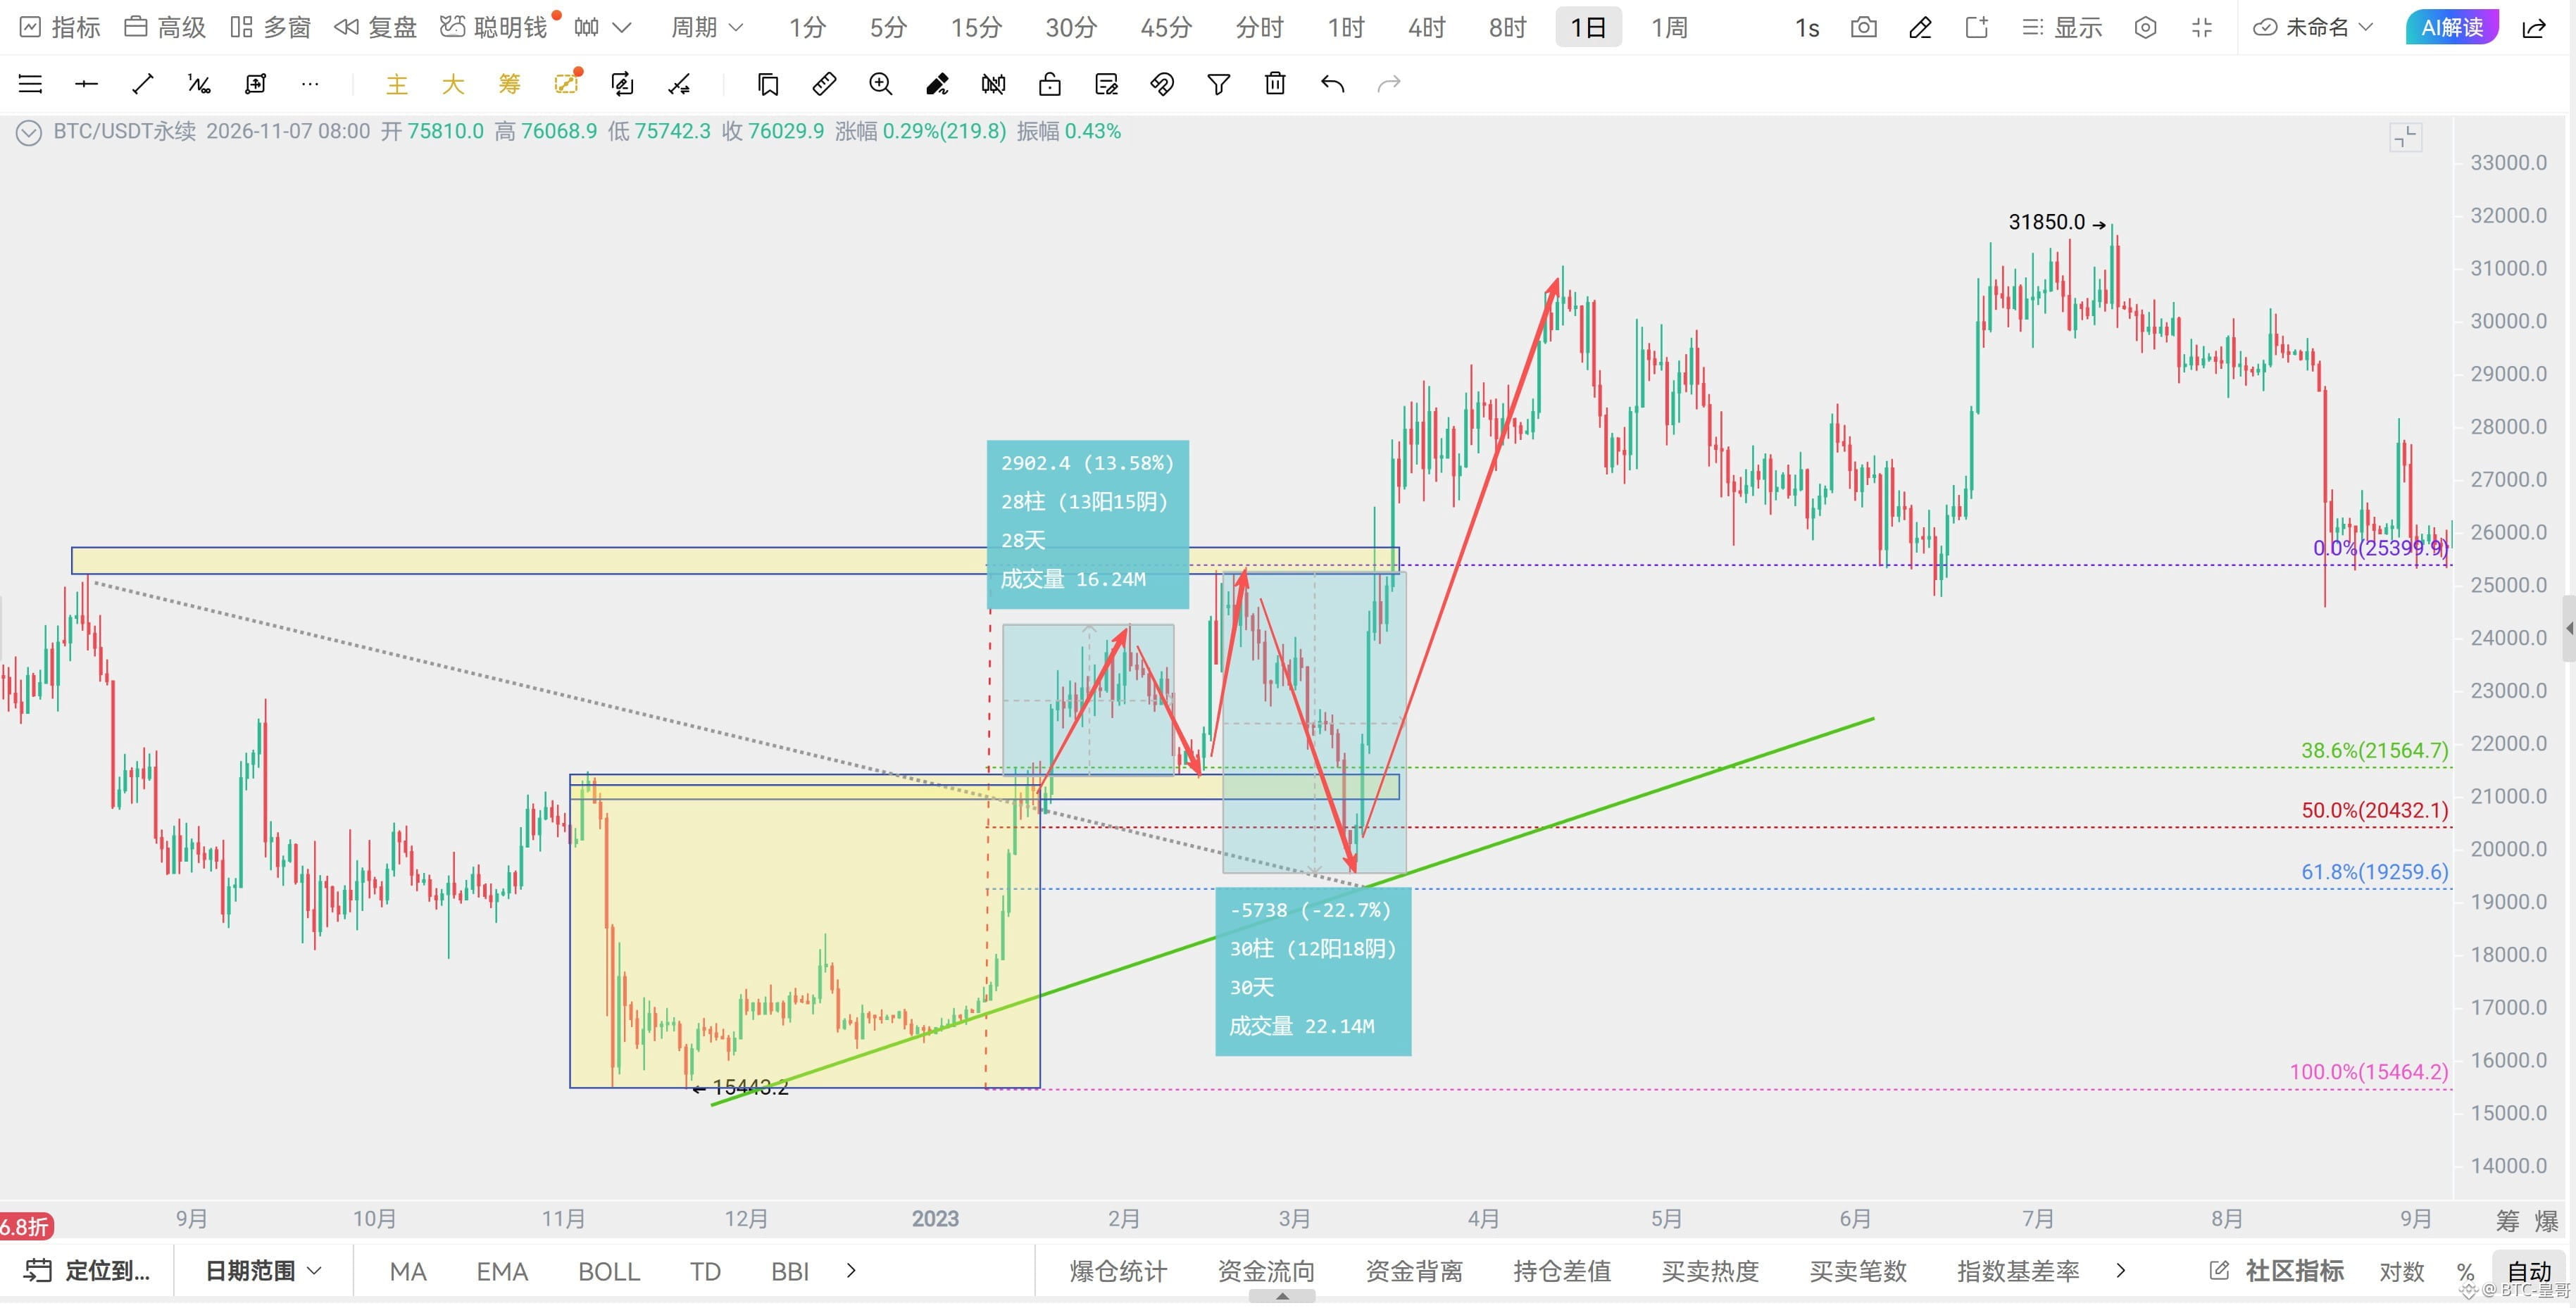
Now let’s look at the structure in Chart 3: for now, watch support near the 0.5 Fibonacci retracement level below and the green ascending trendline. The current support zone is 71,800–72,680. If that breaks, the next level to watch is the 0.618 support near 69,000. Looking back at the start of the previous bull run in Chart 4, price pulled back to between 0.5 and 0.618 before beginning another powerful rally.
Considering the structure above, here’s the suggested approach: Spot traders who are currently out of the market can gradually build a position of around 50% this week near 72,000–72,800. If price reaches 70,000–70,800, add another 25–30%. Exit if it breaks below 69,000. For short-term leveraged contract traders: if you’re holding a short entered around 74,700, set a breakeven stop and move your take-profit target to around 73,000. Then watch for a chance to go long near 72,000. Stay tuned—the chat room will share trade signals at any time.
$ETH $PEPE
#黄仁勋因婚外情致歉,英伟达启动独立调查
Bitcoin is trading at 74,300+.
Bitcoin has been tracking the U.S. stock market fairly closely lately. As I’ve been reminding you over the past few days, if you’re holding long positions, make sure you have a defense plan. You could set 74,700 as your exit point; if price moves that way, I’ll look to short from the right-hand side down to 72,100–72,600.
The weekly candle closes today, still marking five consecutive red candles. Fortunately, trading volume has been low. The weekly price is also currently at the Bollinger Band middle line, so this week’s close is crucial. If it closes above the middle line by Monday morning, the broader bullish trend may continue. If it closes below, things could get dangerous.
Now let’s look at the structure in Chart 3: for now, watch support near the 0.5 Fibonacci retracement level below and the green ascending trendline. The current support zone is 71,800–72,680. If that breaks, the next level to watch is the 0.618 support near 69,000. Looking back at the start of the previous bull run in Chart 4, price pulled back to between 0.5 and 0.618 before beginning another powerful rally.
Considering the structure above, here’s the suggested approach: Spot traders who are currently out of the market can gradually build a position of around 50% this week near 72,000–72,800. If price reaches 70,000–70,800, add another 25–30%. Exit if it breaks below 69,000. For short-term leveraged contract traders: if you’re holding a short entered around 74,700, set a breakeven stop and move your take-profit target to around 73,000. Then watch for a chance to go long near 72,000. Stay tuned—the chat room will share trade signals at any time.
$ETH $PEPE
#黄仁勋因婚外情致歉,英伟达启动独立调查