$BTC BTC has broken below the lower Bollinger Band. The 74600 long is just 150 bucks away from its 74300 stop-loss.
The 2-hour chart looks ugly: price has broken below the lower Bollinger Band at 74462, the first time since late October. It’s hugging the lower band and accelerating downward. The moving averages are all overhead, forming a thick wall of resistance. The MACD green bars are growing below the zero line, with the gap widening to the downside. The bears haven’t let up at all. The TD buy count has just printed its first bar—one bar alone doesn’t tell us anything.
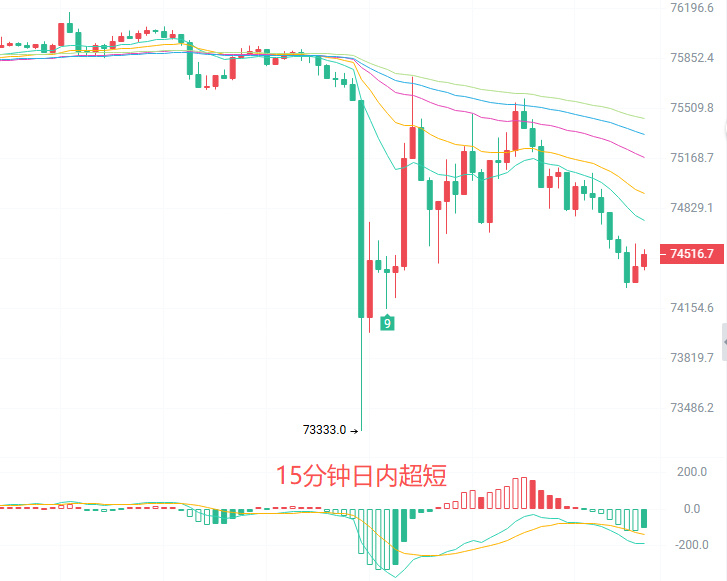
The 15-minute chart is clearer: it closed at 74440. It looks like a small bullish bounce, but the entire rally from 73333 has already been given back. The MACD green bars are expanding again, and DIF has crossed below DEA for a second time. Price is also still below EMA15 at 74783 and the Bollinger Band middle line at 74943. The TD sell count is at bar 7; the short-term retest of the lows isn’t over.
First, for anyone already in a trade: if you’re long from 74600, you must stick to your 74300 stop-loss. If it breaks, don’t hold on.
New long: If price pulls back to 73800–74000 and stabilizes, enter with a small position. Stop-loss below 73400; target 74900–75300.
New short: If price bounces to 74900–75100 and meets resistance, enter with a small position. Stop-loss above 75400; target 74000–73500.
Keep your position size below 20%. If you’re wrong, admit it.
When price breaks below the lower band, the worst thing you can do is buy the dip just because it looks oversold. It can get even more oversold, and the green bars may be longer tomorrow. Trade at your own risk. Follow me, and let’s review the charts together.
#BTC走势分析
The 2-hour chart looks ugly: price has broken below the lower Bollinger Band at 74462, the first time since late October. It’s hugging the lower band and accelerating downward. The moving averages are all overhead, forming a thick wall of resistance. The MACD green bars are growing below the zero line, with the gap widening to the downside. The bears haven’t let up at all. The TD buy count has just printed its first bar—one bar alone doesn’t tell us anything.
The 15-minute chart is clearer: it closed at 74440. It looks like a small bullish bounce, but the entire rally from 73333 has already been given back. The MACD green bars are expanding again, and DIF has crossed below DEA for a second time. Price is also still below EMA15 at 74783 and the Bollinger Band middle line at 74943. The TD sell count is at bar 7; the short-term retest of the lows isn’t over.
First, for anyone already in a trade: if you’re long from 74600, you must stick to your 74300 stop-loss. If it breaks, don’t hold on.
New long: If price pulls back to 73800–74000 and stabilizes, enter with a small position. Stop-loss below 73400; target 74900–75300.
New short: If price bounces to 74900–75100 and meets resistance, enter with a small position. Stop-loss above 75400; target 74000–73500.
Keep your position size below 20%. If you’re wrong, admit it.
When price breaks below the lower band, the worst thing you can do is buy the dip just because it looks oversold. It can get even more oversold, and the green bars may be longer tomorrow. Trade at your own risk. Follow me, and let’s review the charts together.
#BTC走势分析