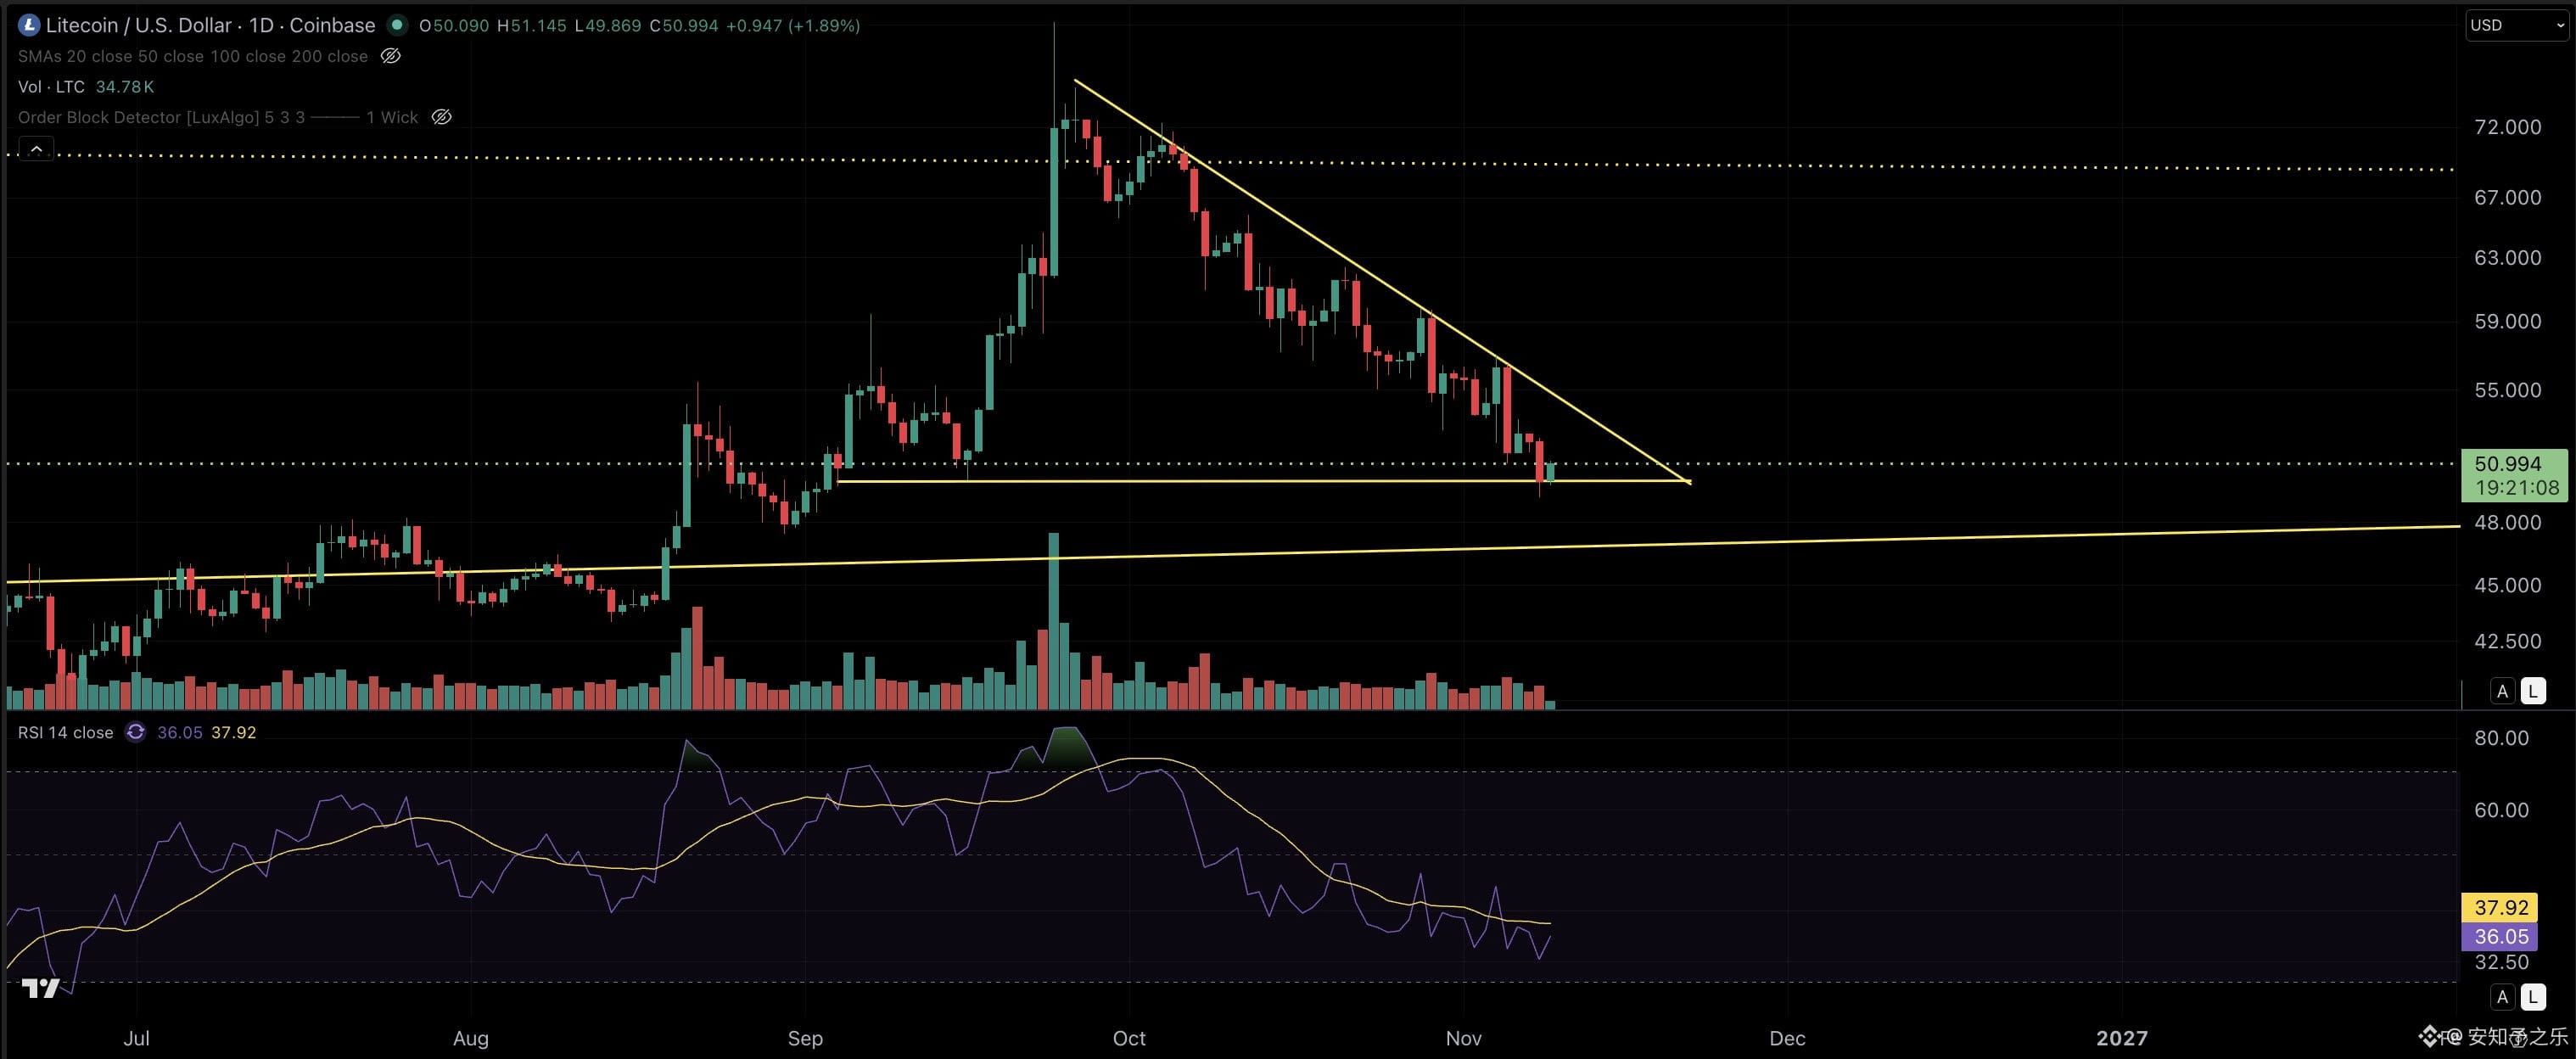
$LTC The current structure looks like this: the weekly chart has consistently held above the lower support track, while switching to the daily chart gives us a closer look and makes the price’s position relative to the track clearer.
And it’s not just LTC—quite a few assets are now sitting in the lower half of their respective structures. This cross-asset convergence is actually pointing toward a “bottoming bias.”
If we’re talking about a reversal, we may first need a liquidity sweep that pushes the price down toward the macro track. So the key isn’t whether there’s a sweep, but how quickly the price recovers afterward.
And it’s not just LTC—quite a few assets are now sitting in the lower half of their respective structures. This cross-asset convergence is actually pointing toward a “bottoming bias.”
If we’re talking about a reversal, we may first need a liquidity sweep that pushes the price down toward the macro track. So the key isn’t whether there’s a sweep, but how quickly the price recovers afterward.