



Bitcoin ended the week on November 8 at $74,968, 0.7% below the 50-week moving average. This ended a seven-week streak of staying above that level, a line that Alex Thorn of Galaxy has linked to past bear-market bottoms.
For Bitcoin holders, attention is now turning to the June 28 weekly close of $59,517, the cycle low. On the two previous occasions, a drop to this level did not affect the bear-market bottom. This time, however, Bitcoin has less room to rise above that low.
Bitcoin Falls Back Below the 50-Week Moving Average
The 50-week moving average is the simple average of Bitcoin’s 50 most recent weekly closing prices. According to Galaxy, Bitcoin reclaimed this level on September 20, 12 weeks after its June low.
Starting from the reclaim close of $81,195, Bitcoin finished above the average for 7 consecutive weeks. The November 8 close was 7.7% below that level, but still 26% above the June low.
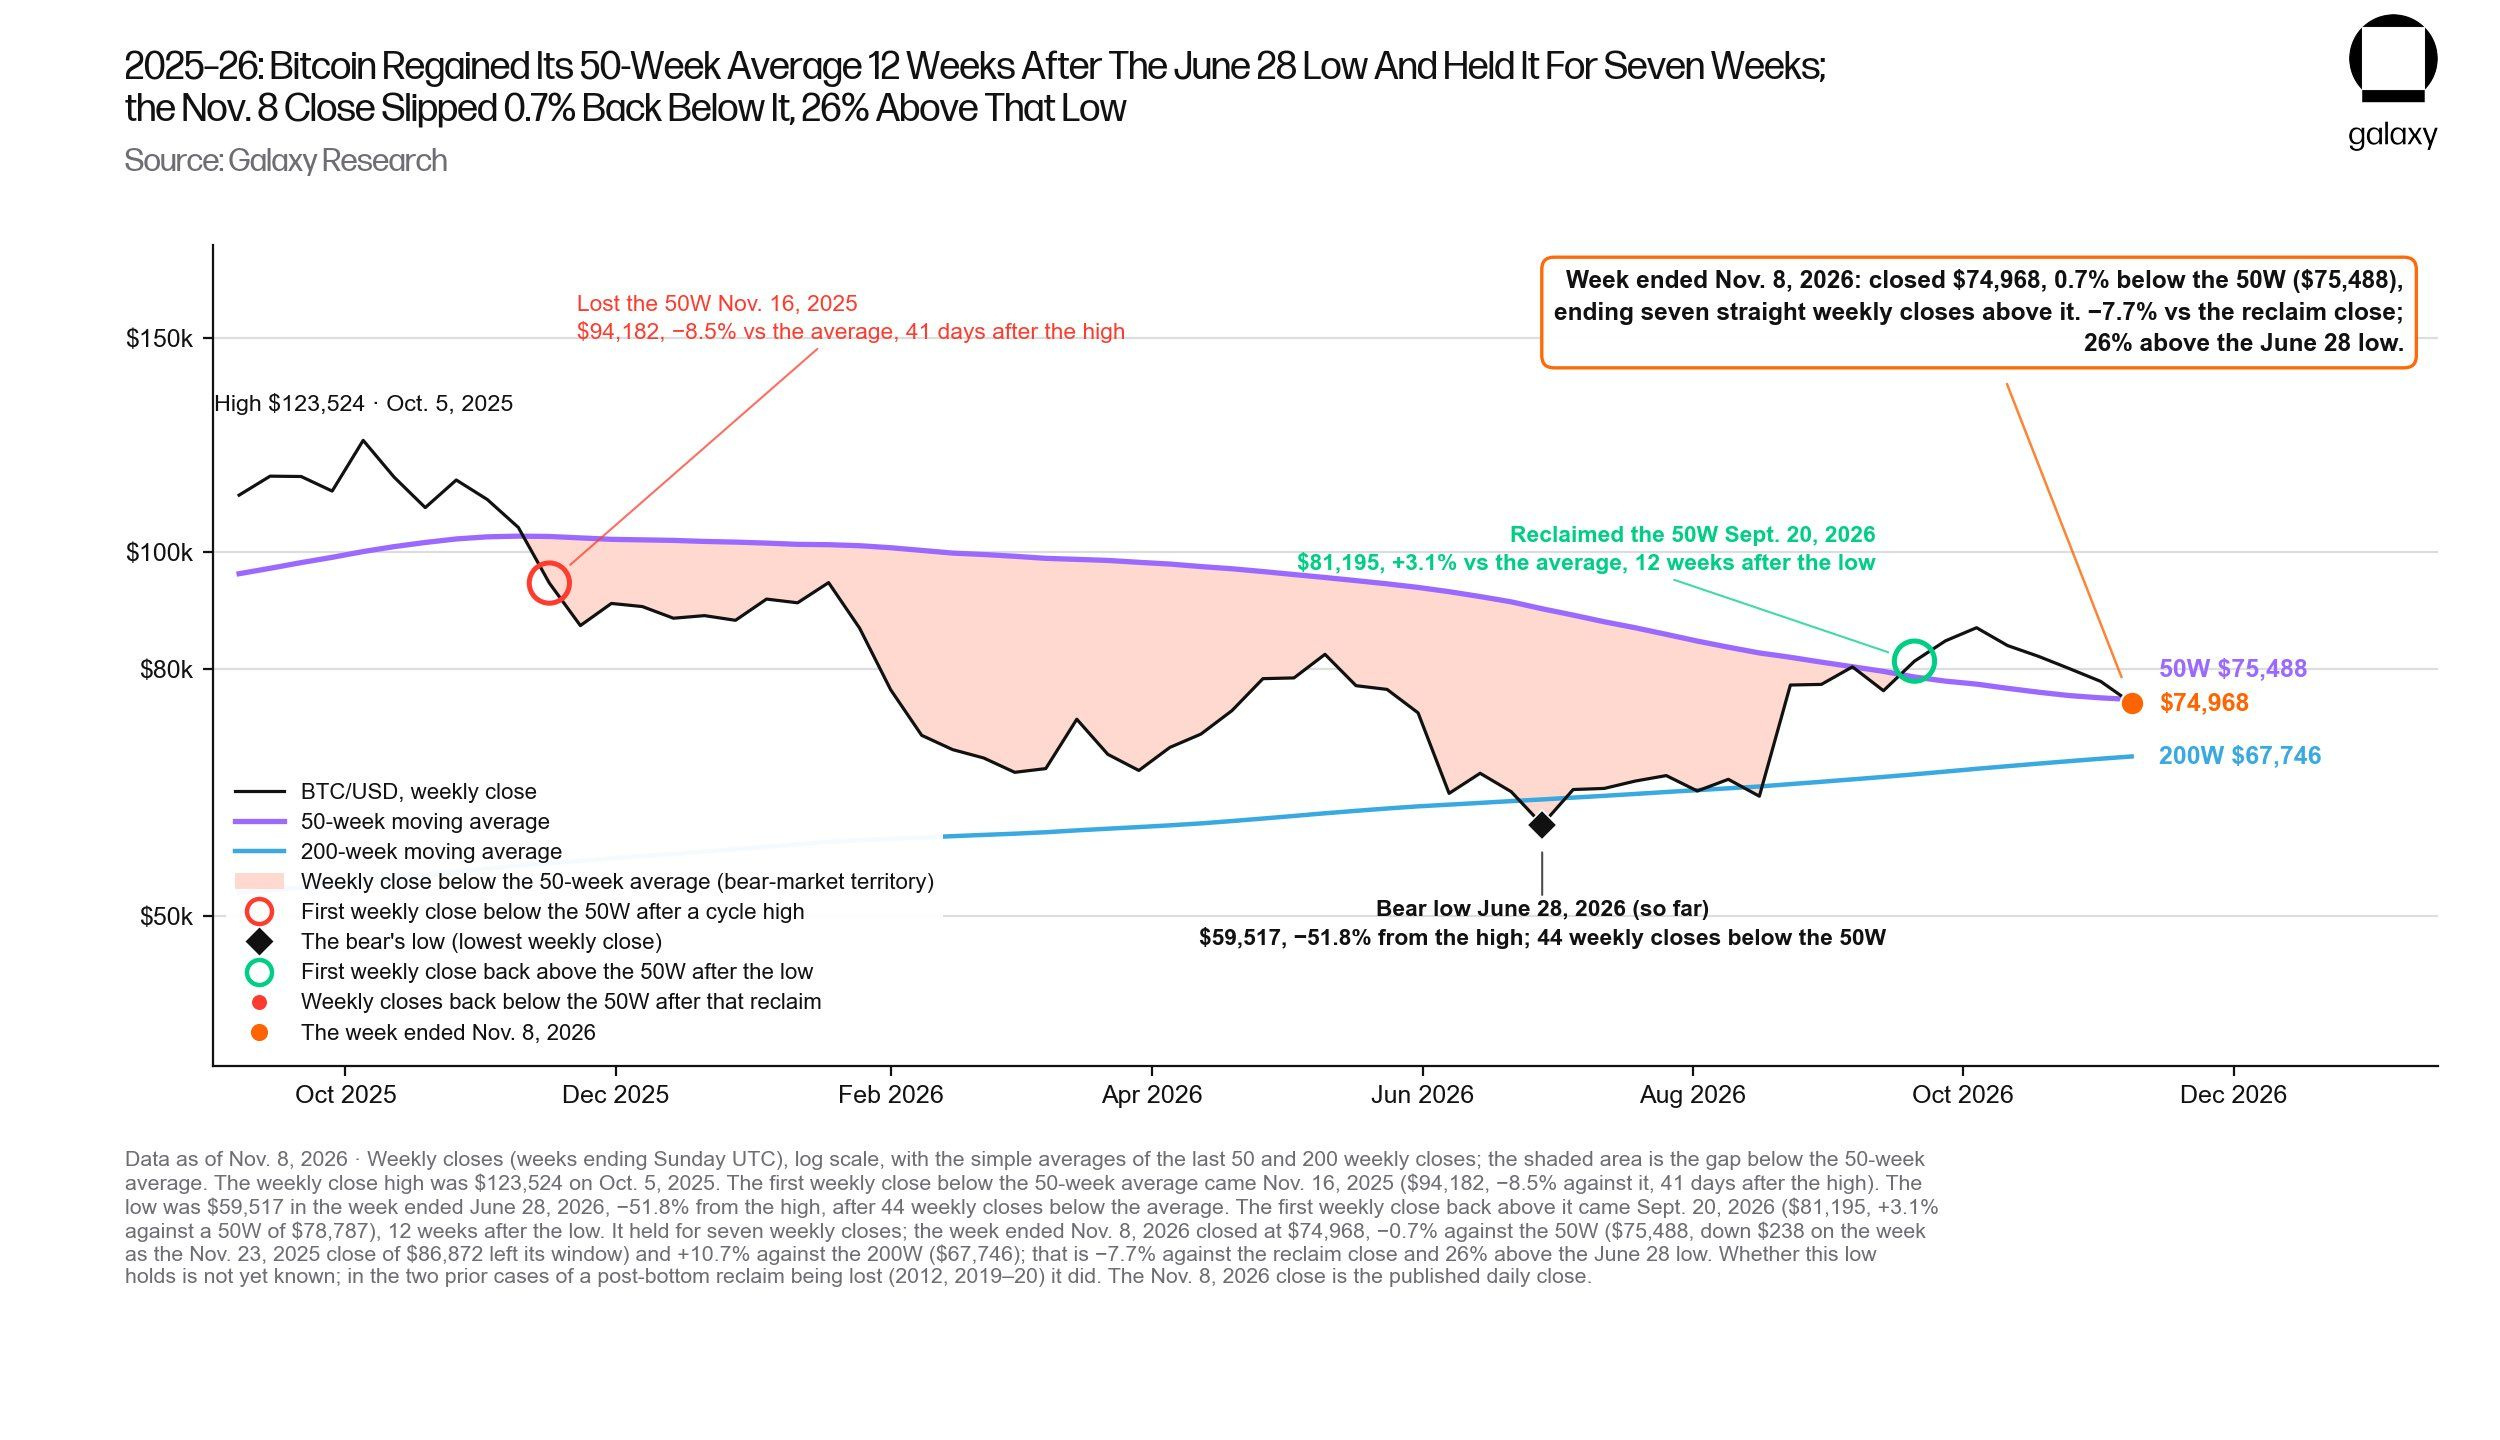
According to BeInCrypto Markets, Bitcoin was trading at $75,031 at the time of writing, down 0.86% over the past 24 hours. This puts the price about 0.6% below the average.
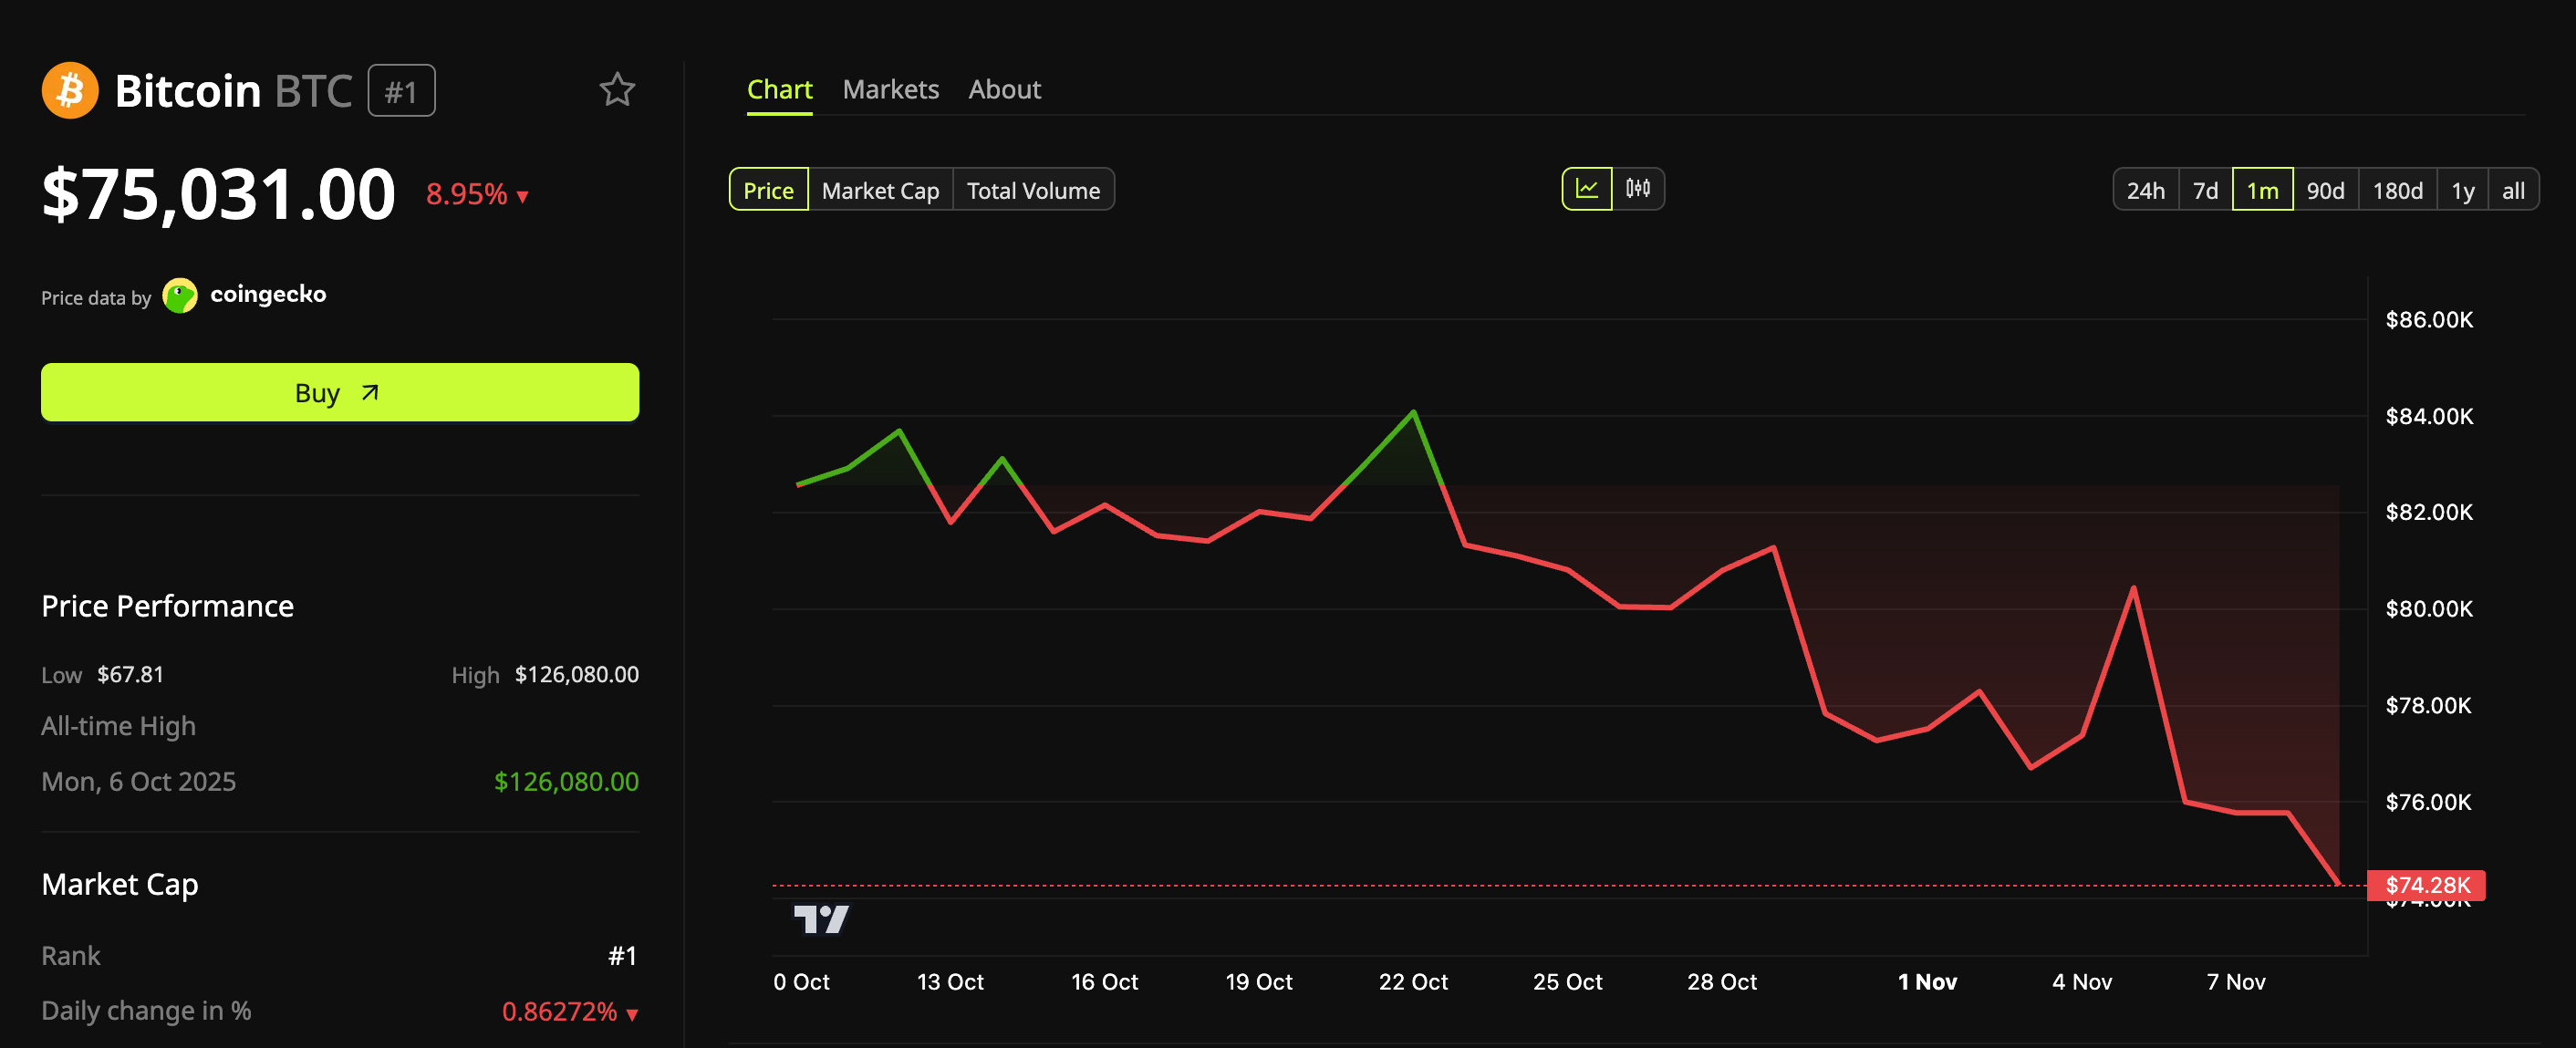
The weekly close also came at the end of a weekend that saw multiple forced liquidations in the crypto market, hitting long positions hardest. Galaxy’s chart shows that post-bottom recoveries have lost ground before, though only twice.
The Two Most Recent Cycles Lost Their Reclaims but Held Their Lows
Thorn, Galaxy’s head of firm-wide research, has counted 5 post-bottom price reclaims of the average since 2012. That total includes September.
Of the four previous reclaims, those in 2015 and 2023 held until Bitcoin regained its previous high. The other two failed, but both stayed above the bear market low.
Here’s how those two pullbacks unfolded.
The 2011–2012 Cycle
Bitcoin crossed this level in January 2012, gaining nearly 18%.
It fell below that level three weeks later and stayed there for 20 weeks.
The lowest closing price was $4.39, still 99% above the 2011 bear market low.
Bitcoin regained its previous high in February 2013.
The 2019–2020 Cycle
The May 2019 reclaim began with a 5.7% cushion and held for 29 weeks.
Bitcoin then fell below the level five times, with the worst drop coming during the March 2020 COVID crash.
The lowest closing price was $5,359, still 68% above the 2018 bear market low.
Bitcoin regained its previous high in December 2020.
In both cases, Bitcoin regained its previous high within two years of the reclaim.
Why Does Bitcoin’s 2026 “Cushion” Look Thinner?
At the time of the September reclaim, Bitcoin had closed about 36% above its June low. In 2019, the reclaim close was about 79% above the bear market low, and in 2012 it was about 223%.
By another measure, the current pullback has gone further than in 2020. The November 8 close was 7.7% below the reclaim close, compared with a 6.5% decline in 2020.
The 2012 retest fell 38.1% from the reclaim close. A similar decline from $81,195 would put Bitcoin around $50,260, below its June low.
However, Thorn cautioned that the size of the cushion does not always predict the outcome accurately. The 2012 reclaim failed despite an 18% cushion, while the 2015 reclaim succeeded with only an 8% cushion.
Galaxy’s chart also shows 2 closes above the line in December 2021 and March 2022. Both occurred before that cycle’s bottom, followed by a lower low.
Therefore, Thorn’s findings include only reclaims made after the Bitcoin market bottomed during a bear market. He also emphasized that the sample is very small.
“Note: The five reclaims are the entire sample, and a ‘bottom’ can only be identified after the fact. For 2026, that means the support level is $59,517,” he said.
What Does Bitcoin Need to Keep Its Bottom Signal Intact?
The first test is the next weekly close relative to the 50-week average, currently around $75,488. Below that is the 200-week moving average at $67,746.
The June low of $59,517 is the level Thorn says must hold for the Bitcoin bottom call to be validated. In the four completed bear market cycles on Galaxy’s chart, no post-reclaim close fell below the low.