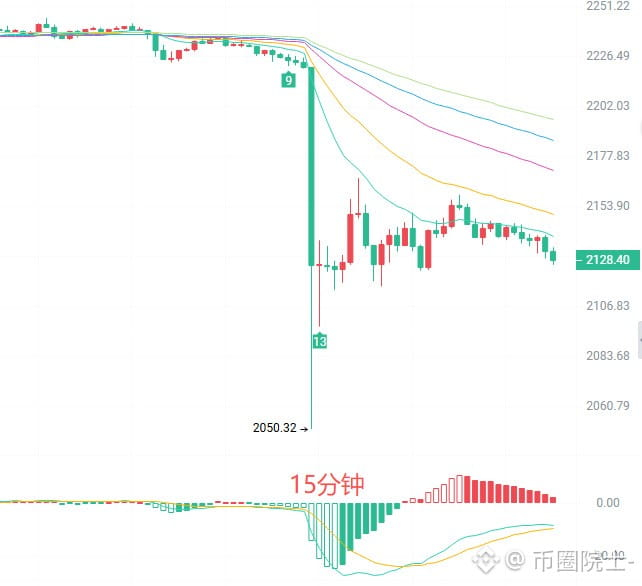
$ETH Guys! ETH has crashed again!
It plunged straight from 2235 to 2100, and is now catching its breath at 2127. Yesterday we were saying 2166 would hold, but today one big red candle broke right through it. How many people bought the dip at 2170 and got buried?
In plain English:
On the 2-hour chart, all five moving averages are overhead; the bearish alignment is still intact.
The MACD histogram has grown to -20.52, and bears are still accelerating—this isn’t a market that’s run out of room to fall.
Bollinger Bands are opening downward, with the lower band at 2119; price is hugging the edge of the channel.
On the 15-minute chart, price has just bounced back from 2050, but the MACD histogram is only 1.94—very weak.
The rebound ceiling is 2139 to 2154. TD is already at 6, so another sell-off could come at any moment.
What’s the plan?
If you want to short in line with the main trend: wait for a rebound to 2139 to 2154 that fails, with a long upper wick. Short with a small position, set a stop above 2160, and target 2119 to 2050.
If you want to buy the dip, I’d urge you to stay calm: wait for 2119 to 2100 to hold and a long lower wick to form. Try with a tiny position, set a stop at 2090, and get out at 2140.
Keep your position size under 20%. If you’re wrong, admit it—don’t fall in love with the market.
These are just my chart-watching thoughts, not investment advice. Before placing an order, think carefully about how much you can afford to lose. Like and follow, and I’ll be here again after tomorrow’s market close to break things down with you!
#ETH走势分析
It plunged straight from 2235 to 2100, and is now catching its breath at 2127. Yesterday we were saying 2166 would hold, but today one big red candle broke right through it. How many people bought the dip at 2170 and got buried?
In plain English:
On the 2-hour chart, all five moving averages are overhead; the bearish alignment is still intact.
The MACD histogram has grown to -20.52, and bears are still accelerating—this isn’t a market that’s run out of room to fall.
Bollinger Bands are opening downward, with the lower band at 2119; price is hugging the edge of the channel.
On the 15-minute chart, price has just bounced back from 2050, but the MACD histogram is only 1.94—very weak.
The rebound ceiling is 2139 to 2154. TD is already at 6, so another sell-off could come at any moment.
What’s the plan?
If you want to short in line with the main trend: wait for a rebound to 2139 to 2154 that fails, with a long upper wick. Short with a small position, set a stop above 2160, and target 2119 to 2050.
If you want to buy the dip, I’d urge you to stay calm: wait for 2119 to 2100 to hold and a long lower wick to form. Try with a tiny position, set a stop at 2090, and get out at 2140.
Keep your position size under 20%. If you’re wrong, admit it—don’t fall in love with the market.
These are just my chart-watching thoughts, not investment advice. Before placing an order, think carefully about how much you can afford to lose. Like and follow, and I’ll be here again after tomorrow’s market close to break things down with you!
#ETH走势分析