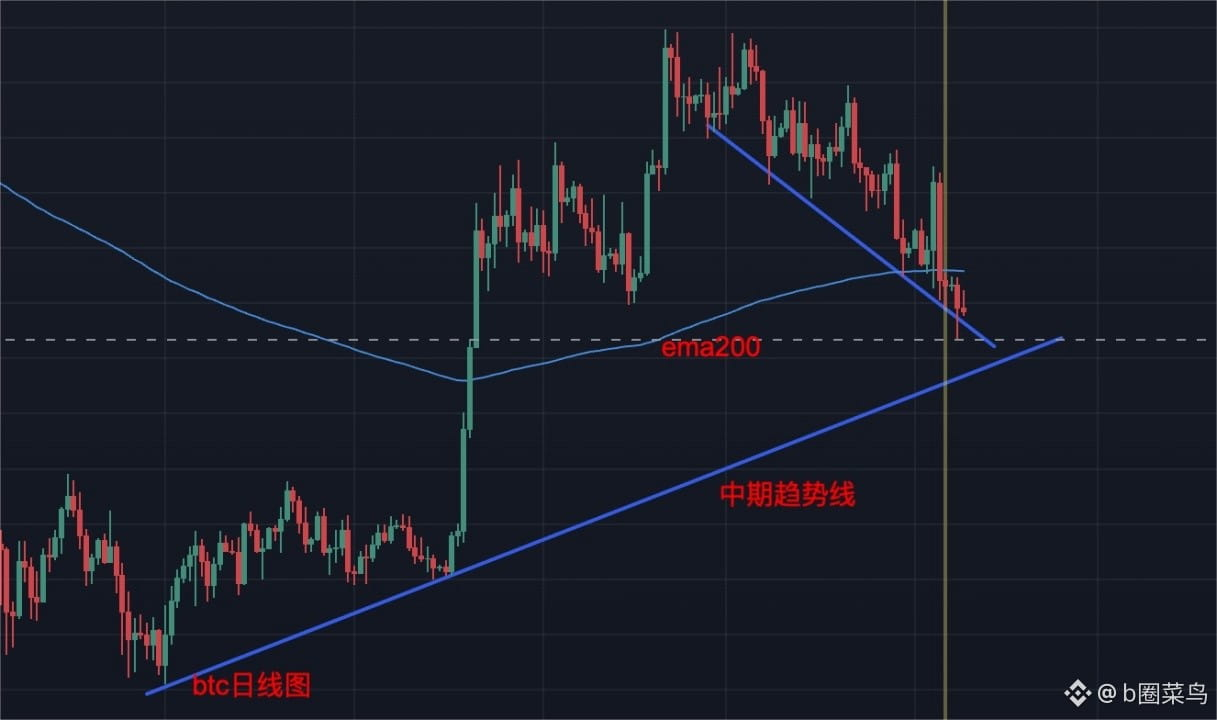
$BTC On the daily chart, the price has now fallen below the EMA200, and the short-term trend has clearly weakened. The descending trendline overhead continues to cap the price, with highs moving lower, indicating that bears still have some control. The price is currently testing the medium-term ascending trendline below, which is also an important support level for the broader uptrend.
Pay close attention to two things next: first, whether the price can reclaim the EMA200. If it continues to fail to move back above it, any rebound may be no more than a weak recovery. Second, whether the ascending trendline below can hold. If the price breaks below it decisively again, it would mean that the previous uptrend structure may have been damaged, and the market could enter a larger correction.
In summary: the descending trendline overhead is acting as resistance, the EMA200 in the middle has already been lost, and the ascending trendline below is now being tested. Bulls are currently on the back foot, and whether the trendline holds will be the most important thing to watch on BTC’s daily chart.#BTC走势分析
Pay close attention to two things next: first, whether the price can reclaim the EMA200. If it continues to fail to move back above it, any rebound may be no more than a weak recovery. Second, whether the ascending trendline below can hold. If the price breaks below it decisively again, it would mean that the previous uptrend structure may have been damaged, and the market could enter a larger correction.
In summary: the descending trendline overhead is acting as resistance, the EMA200 in the middle has already been lost, and the ascending trendline below is now being tested. Bulls are currently on the back foot, and whether the trendline holds will be the most important thing to watch on BTC’s daily chart.#BTC走势分析