$DOT Volume Clues
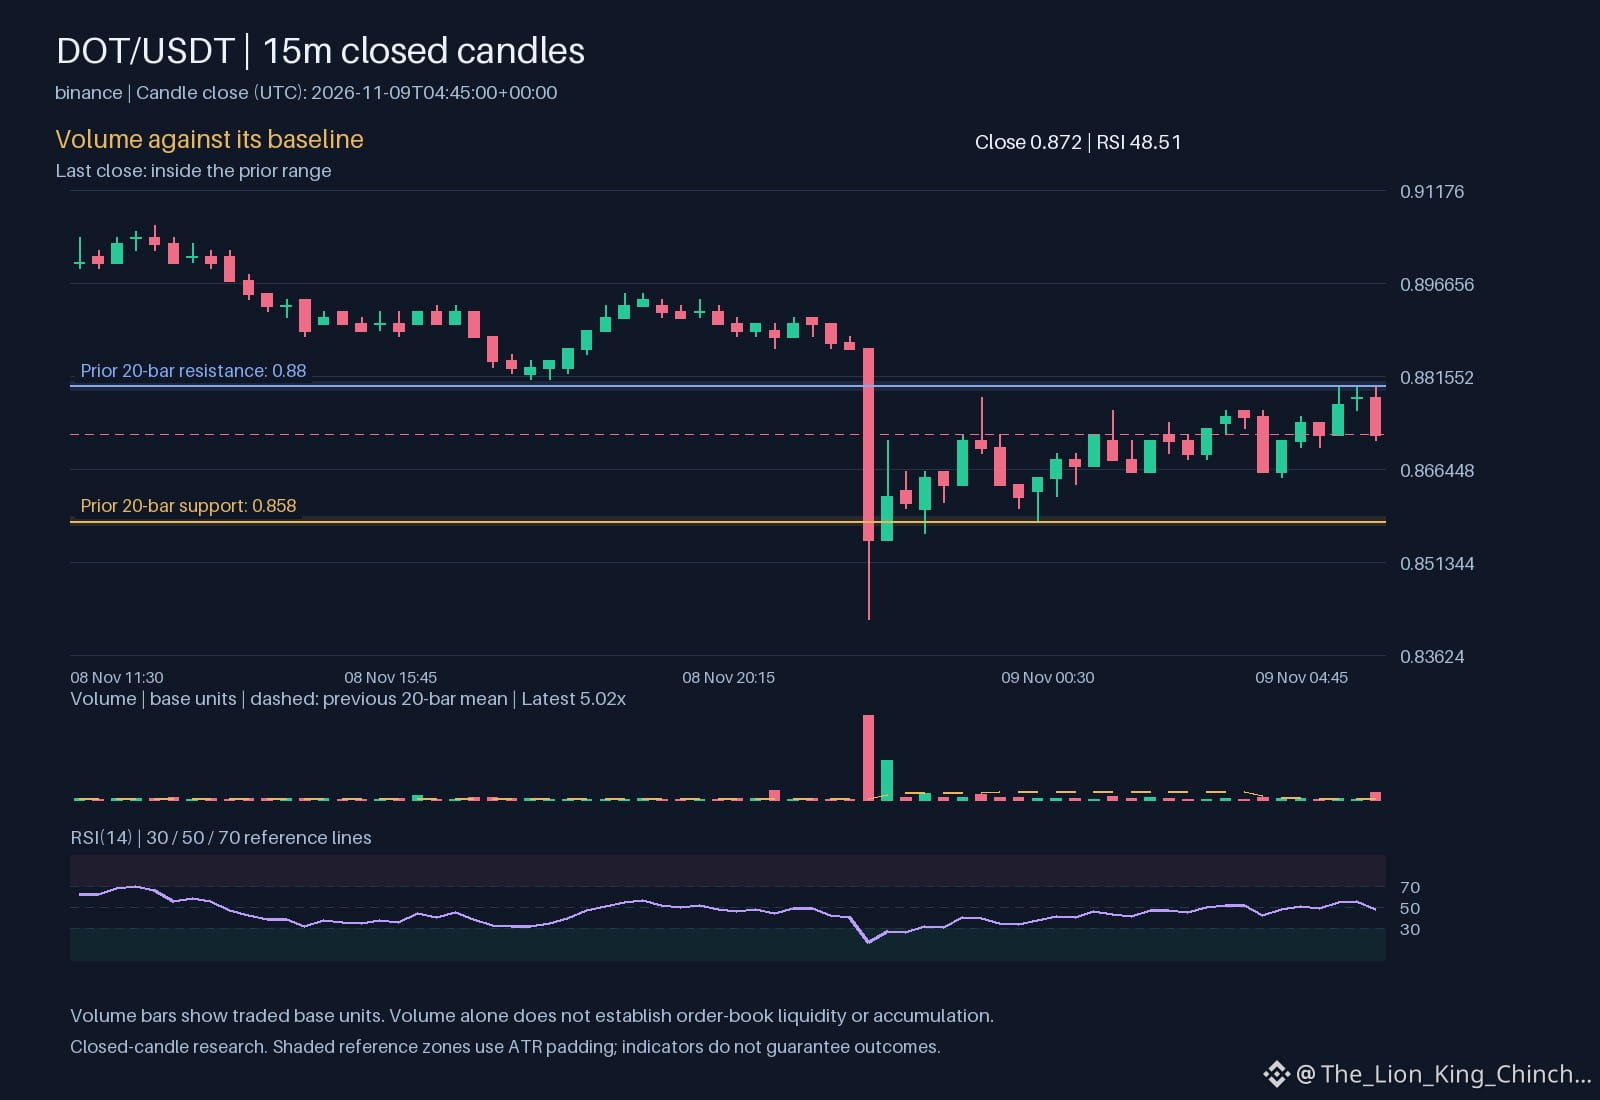
Why does above baseline volume appear with a downward hourly direction? This specific combination invites a detective to ask whether sellers are forcing the price down or if a corrective phase is clearing out weak hands. The recorded relative volume is 5.0178. This metric suggests activity exceeds the usual daily baseline. However, volume alone does not confirm intent. It measures effort, not conviction.
Competing readings of the same move
One interpretation is distribution. Large holders may be selling into strength, causing the hourly drift down. The alternative is accumulation. Smart money might be buying the dip while retail panic drives the hourly direction down. The price sits at 0.872. The moving averages show 0.872659 and 0.876985. These levels act as dynamic support or resistance. If 0.872 holds above the lower average, the accumulation theory gains weight. If it breaks below, distribution looks more likely.
What would change the interpretation
A clean close above 0.88 would weaken the distribution view. It would show buyers absorbed all sell orders. Conversely, a patient retest of 0.858 without breaking it would support the accumulation idea. A break below that level would confirm the downward pressure. The RSI at 48.5136 provides context on momentum. A low value hints at oversold conditions, while a high value suggests overbought territory. The ATR at 0.0060802 measures volatility. Higher values mean wider swings, making any single candle less significant. The MACD at -0.000358085 against its signal line -0.00151683 offers a momentum check. A flip in either direction would change the short-term bias. Until a clear price action signal appears, both scenarios remain possible. The market waits for the next decisive move to reveal who is in charge.
Probabilistic market research, not a recommendation or guaranteed return.
What would convince you: a clean close or a patient retest?
#DOT
Why does above baseline volume appear with a downward hourly direction? This specific combination invites a detective to ask whether sellers are forcing the price down or if a corrective phase is clearing out weak hands. The recorded relative volume is 5.0178. This metric suggests activity exceeds the usual daily baseline. However, volume alone does not confirm intent. It measures effort, not conviction.
Competing readings of the same move
One interpretation is distribution. Large holders may be selling into strength, causing the hourly drift down. The alternative is accumulation. Smart money might be buying the dip while retail panic drives the hourly direction down. The price sits at 0.872. The moving averages show 0.872659 and 0.876985. These levels act as dynamic support or resistance. If 0.872 holds above the lower average, the accumulation theory gains weight. If it breaks below, distribution looks more likely.
What would change the interpretation
A clean close above 0.88 would weaken the distribution view. It would show buyers absorbed all sell orders. Conversely, a patient retest of 0.858 without breaking it would support the accumulation idea. A break below that level would confirm the downward pressure. The RSI at 48.5136 provides context on momentum. A low value hints at oversold conditions, while a high value suggests overbought territory. The ATR at 0.0060802 measures volatility. Higher values mean wider swings, making any single candle less significant. The MACD at -0.000358085 against its signal line -0.00151683 offers a momentum check. A flip in either direction would change the short-term bias. Until a clear price action signal appears, both scenarios remain possible. The market waits for the next decisive move to reveal who is in charge.
Probabilistic market research, not a recommendation or guaranteed return.
What would convince you: a clean close or a patient retest?
#DOT