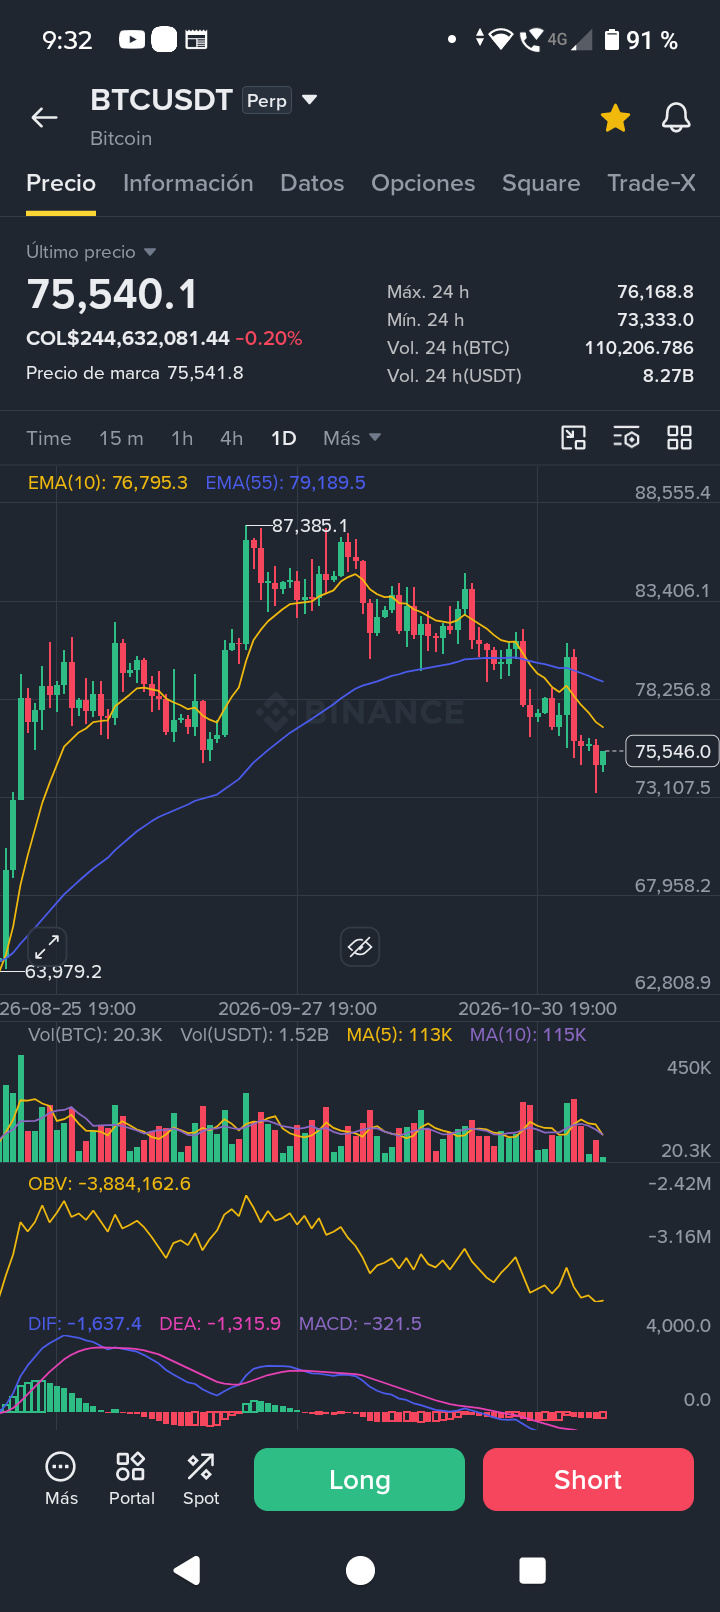

* Current Price: It is around $75,540.1 USDT.
* Exponential Moving Averages (EMA):
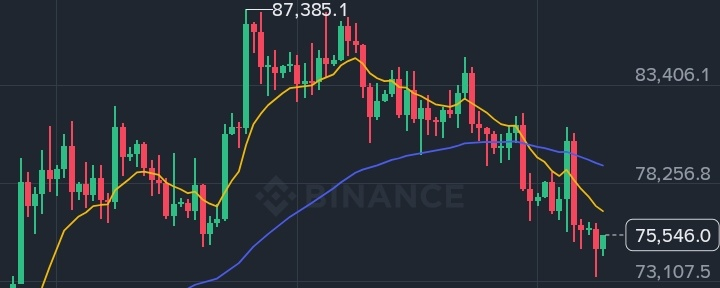
* The EMA(10) (yellow line) is at $76,795.3 and is below the EMA(55) (purple line, at $79,189.5).
* Interpretation: This indicates a short-term bearish trend, as the price is trading below both moving averages and the fast average remains crossed below the slow one.
* MACD Indicator:
* The DIF and DEA lines are in negative territory, with histogram bars weakly red or flat.
* Interpretation: Reflects the persistence of bearish momentum or indecision/consolidation following the correction from recent highs near $87,385.
* OBV (On-Balance Volume):
* Shows a generally downward slope, indicating greater selling pressure (capital outflows) over the past few weeks.
Possible Scenarios
* Bearish Scenario (Continued correction):
* If the price fails to decisively break above the immediate EMA(10) zone (~$76,795), it could seek support again at the recent lows around $73,330, or even test the lower psychological and technical zone if that barrier gives way.
* Bullish Scenario (Rebound / Trend Reversal):
* To consider a short-term structural shift, Bitcoin needs to break above and hold above the EMA(10), then challenge the EMA(55) near $79,189. A sustained, high-volume break above the latter would pave the way for an attempt to reclaim the $83,400–$87,300 zone.
> Note: This analysis is for informational purposes only and is technical in nature, based on price action and the indicators shown in the screenshot.