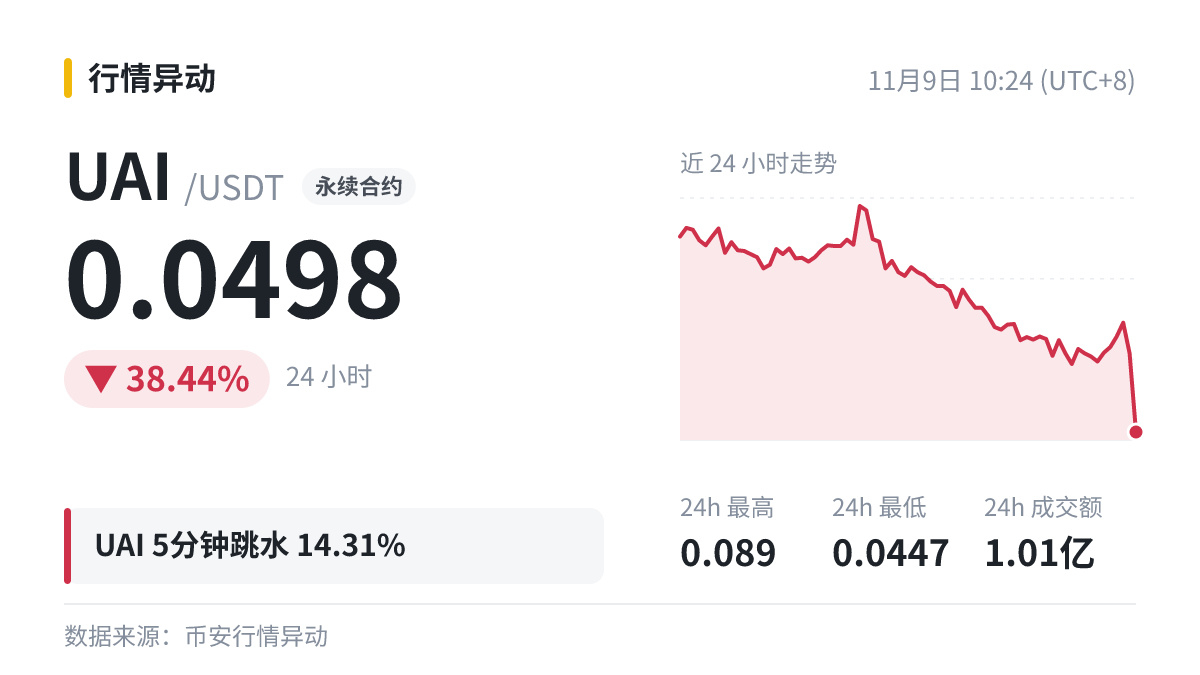
$UAI Intraday weakness signal
5-minute timeframe: -14.31% to 0.0498; 4h: -21.45%.
The daily chart is also weakening (24h: -38.44%). Both short- and long-term timeframes are trending down in the same direction, so treat any rebound as a test of resistance for now.
How do you interpret this information?
#UAI
The data comes from public sources; please verify it yourself.
5-minute timeframe: -14.31% to 0.0498; 4h: -21.45%.
The daily chart is also weakening (24h: -38.44%). Both short- and long-term timeframes are trending down in the same direction, so treat any rebound as a test of resistance for now.
How do you interpret this information?
#UAI
The data comes from public sources; please verify it yourself.