【GTC | Consecutive hourly recovery after a sharp drop; a completed 5-minute candle reclaimed old support】
Binance GTCUSDT perpetual, snapshot at 2026-11-09 10:16:40 Beijing time; 5-minute snapshot price: 0.1878700. This post uses actual perpetual candle opens and closes, and does not present monitored peaks or rolling 1-hour figures as completed-candle results.
Compared with the support at 0.1838700 and resistance at 0.1917400 in the [November 7 record](https://www.binance.com/zh-CN/square/post/385425893409677), this update reviews whether the old structure has been reclaimed.
Today's path: The completed 04:00–05:00 hourly candle fell 5.4438% and closed at 0.1705700; the completed hourly candles at 07:00, 08:00, and 09:00 then rose 1.4853%, 3.3378%, and 2.3017%, respectively. The completed 09:00–10:00 hourly candle closed at 0.1804500, up from 0.1763900, but its close remained below the old support at 0.1838700.
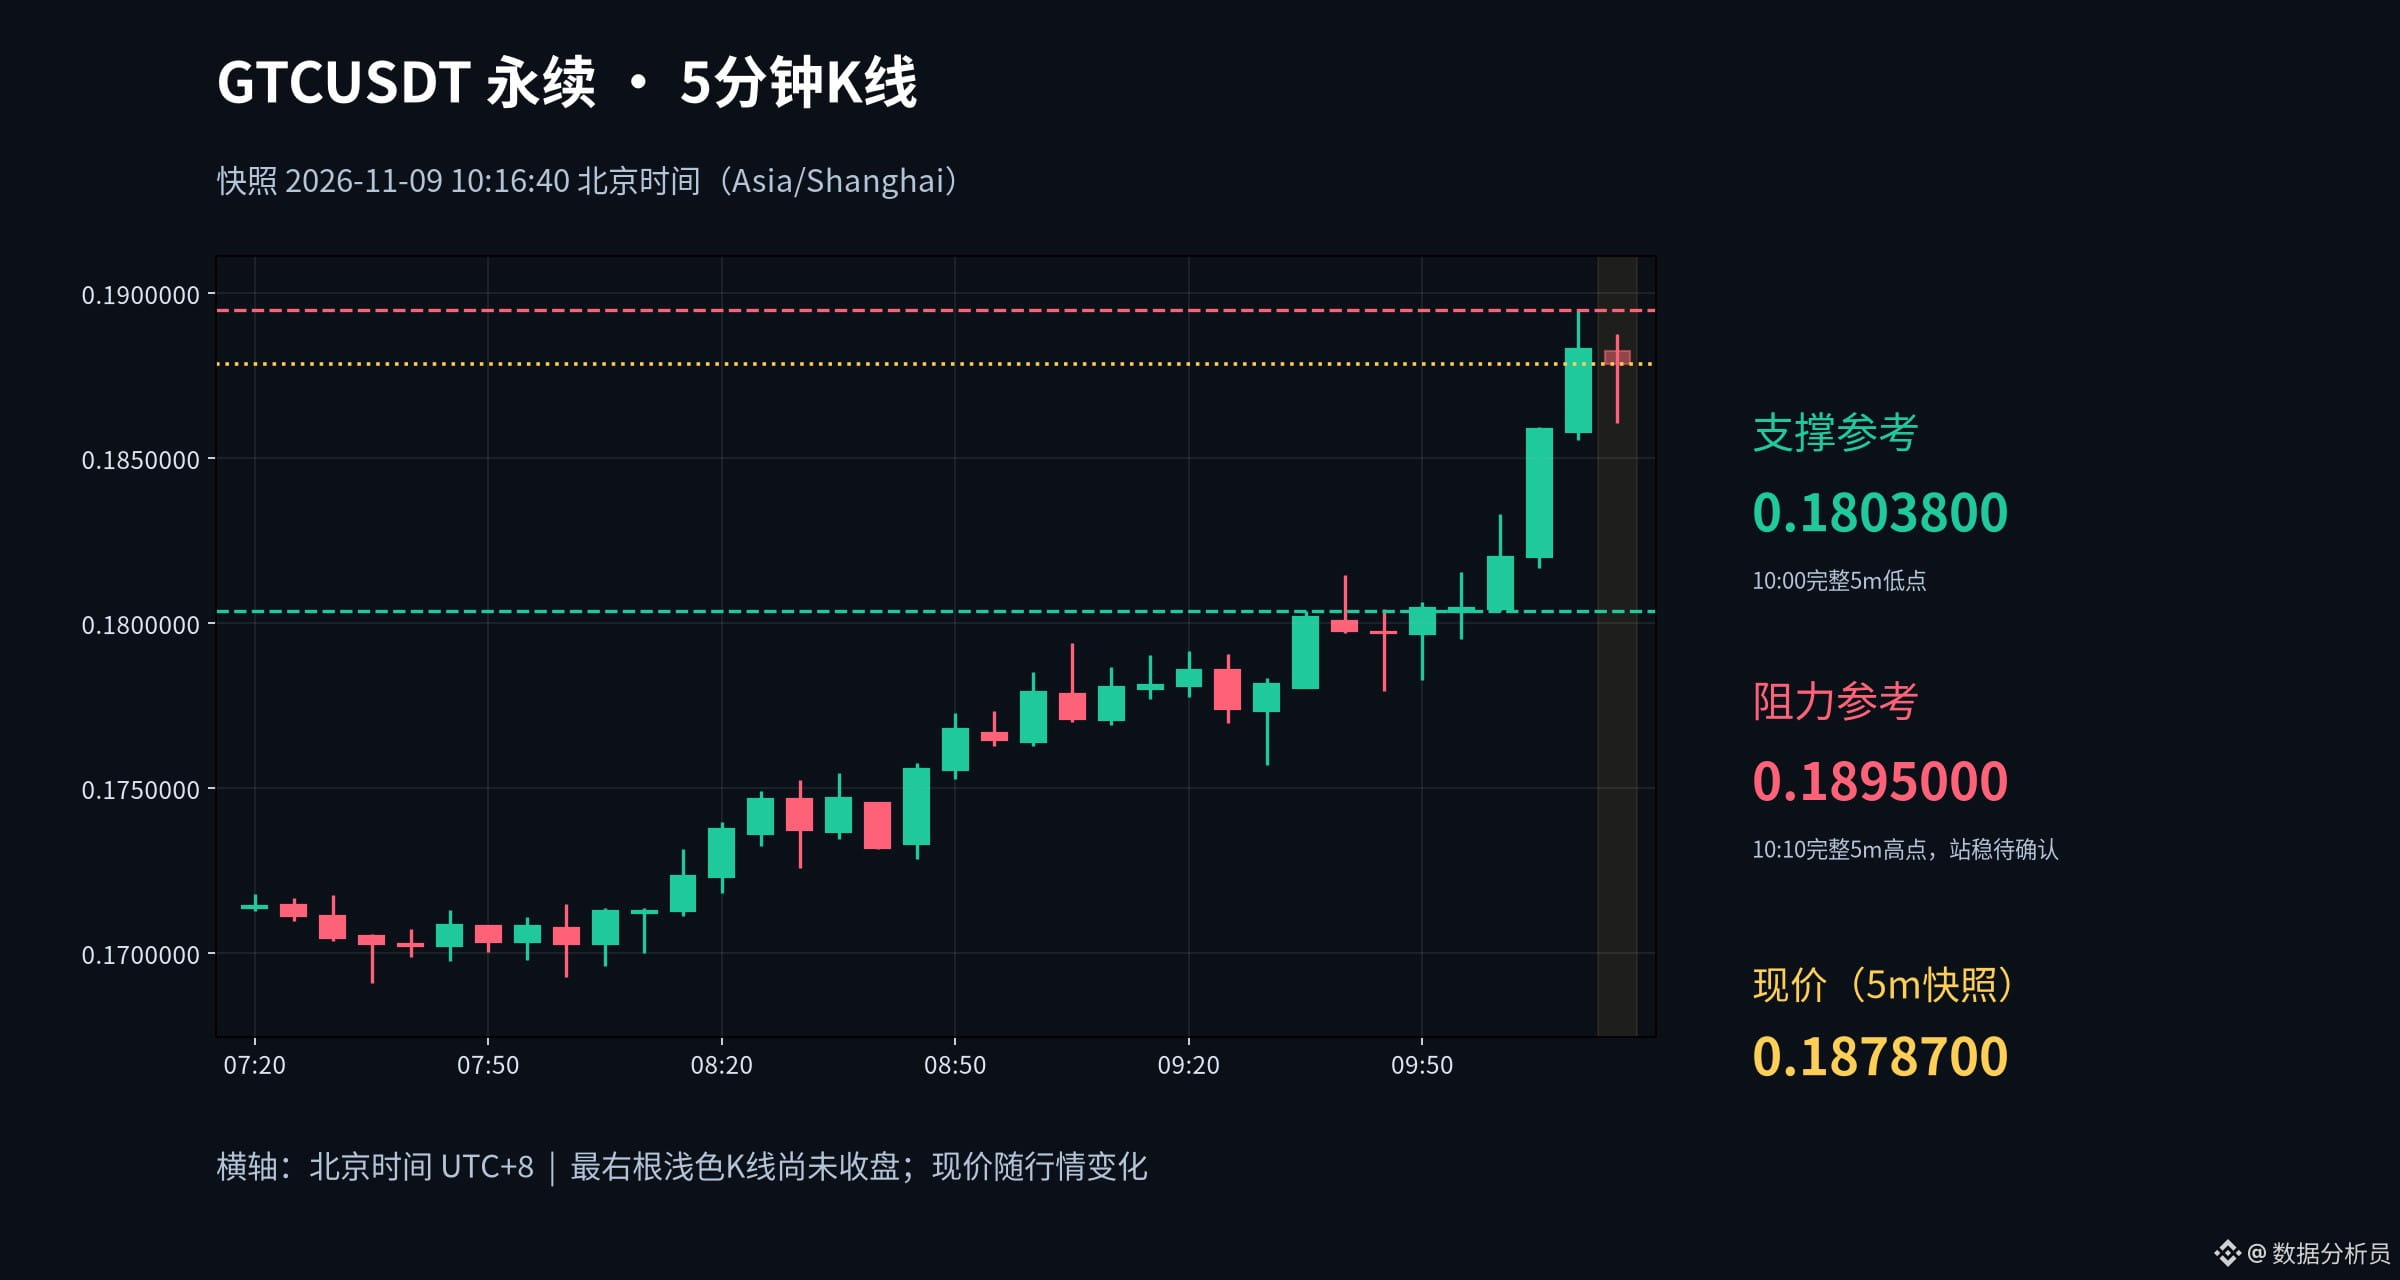
The completed 10:05–10:10 five-minute candle rose 2.1319%, closing at 0.1858800 from 0.1820000. In this recovery, it was the first completed 5-minute candle to close back above the old support. Immediately afterward, the completed 10:10–10:15 five-minute candle rose 1.3455%, closing at 0.1883100 from 0.1858100, with a high of 0.1895000. It remained below the old resistance at 0.1917400, so it cannot be described as having broken through the old resistance.
The current 10:15–10:20 five-minute candle has not yet closed and is temporarily down 0.2072%; the forming 10:00–11:00 hourly candle is temporarily up 4.2401%, which should not be treated as its final hourly gain. The hourly snapshot price of 0.1880700 differs slightly from the 5-minute snapshot because they were requested separately.
The support reference on the chart, 0.1803800, comes from the low of the completed 10:00 five-minute candle; the resistance reference, 0.1895000, comes from the high of the completed 10:10 five-minute candle. Whether price can hold above it still requires confirmation from subsequent closes. The old resistance at 0.1917400 remains overhead, and this chart does not depict it as having been broken.
This records price action only; it does not speculate on the reasons for the rise or provide trading advice.
Binance GTCUSDT perpetual, snapshot at 2026-11-09 10:16:40 Beijing time; 5-minute snapshot price: 0.1878700. This post uses actual perpetual candle opens and closes, and does not present monitored peaks or rolling 1-hour figures as completed-candle results.
Compared with the support at 0.1838700 and resistance at 0.1917400 in the [November 7 record](https://www.binance.com/zh-CN/square/post/385425893409677), this update reviews whether the old structure has been reclaimed.
Today's path: The completed 04:00–05:00 hourly candle fell 5.4438% and closed at 0.1705700; the completed hourly candles at 07:00, 08:00, and 09:00 then rose 1.4853%, 3.3378%, and 2.3017%, respectively. The completed 09:00–10:00 hourly candle closed at 0.1804500, up from 0.1763900, but its close remained below the old support at 0.1838700.
The completed 10:05–10:10 five-minute candle rose 2.1319%, closing at 0.1858800 from 0.1820000. In this recovery, it was the first completed 5-minute candle to close back above the old support. Immediately afterward, the completed 10:10–10:15 five-minute candle rose 1.3455%, closing at 0.1883100 from 0.1858100, with a high of 0.1895000. It remained below the old resistance at 0.1917400, so it cannot be described as having broken through the old resistance.
The current 10:15–10:20 five-minute candle has not yet closed and is temporarily down 0.2072%; the forming 10:00–11:00 hourly candle is temporarily up 4.2401%, which should not be treated as its final hourly gain. The hourly snapshot price of 0.1880700 differs slightly from the 5-minute snapshot because they were requested separately.
The support reference on the chart, 0.1803800, comes from the low of the completed 10:00 five-minute candle; the resistance reference, 0.1895000, comes from the high of the completed 10:10 five-minute candle. Whether price can hold above it still requires confirmation from subsequent closes. The old resistance at 0.1917400 remains overhead, and this chart does not depict it as having been broken.
This records price action only; it does not speculate on the reasons for the rise or provide trading advice.