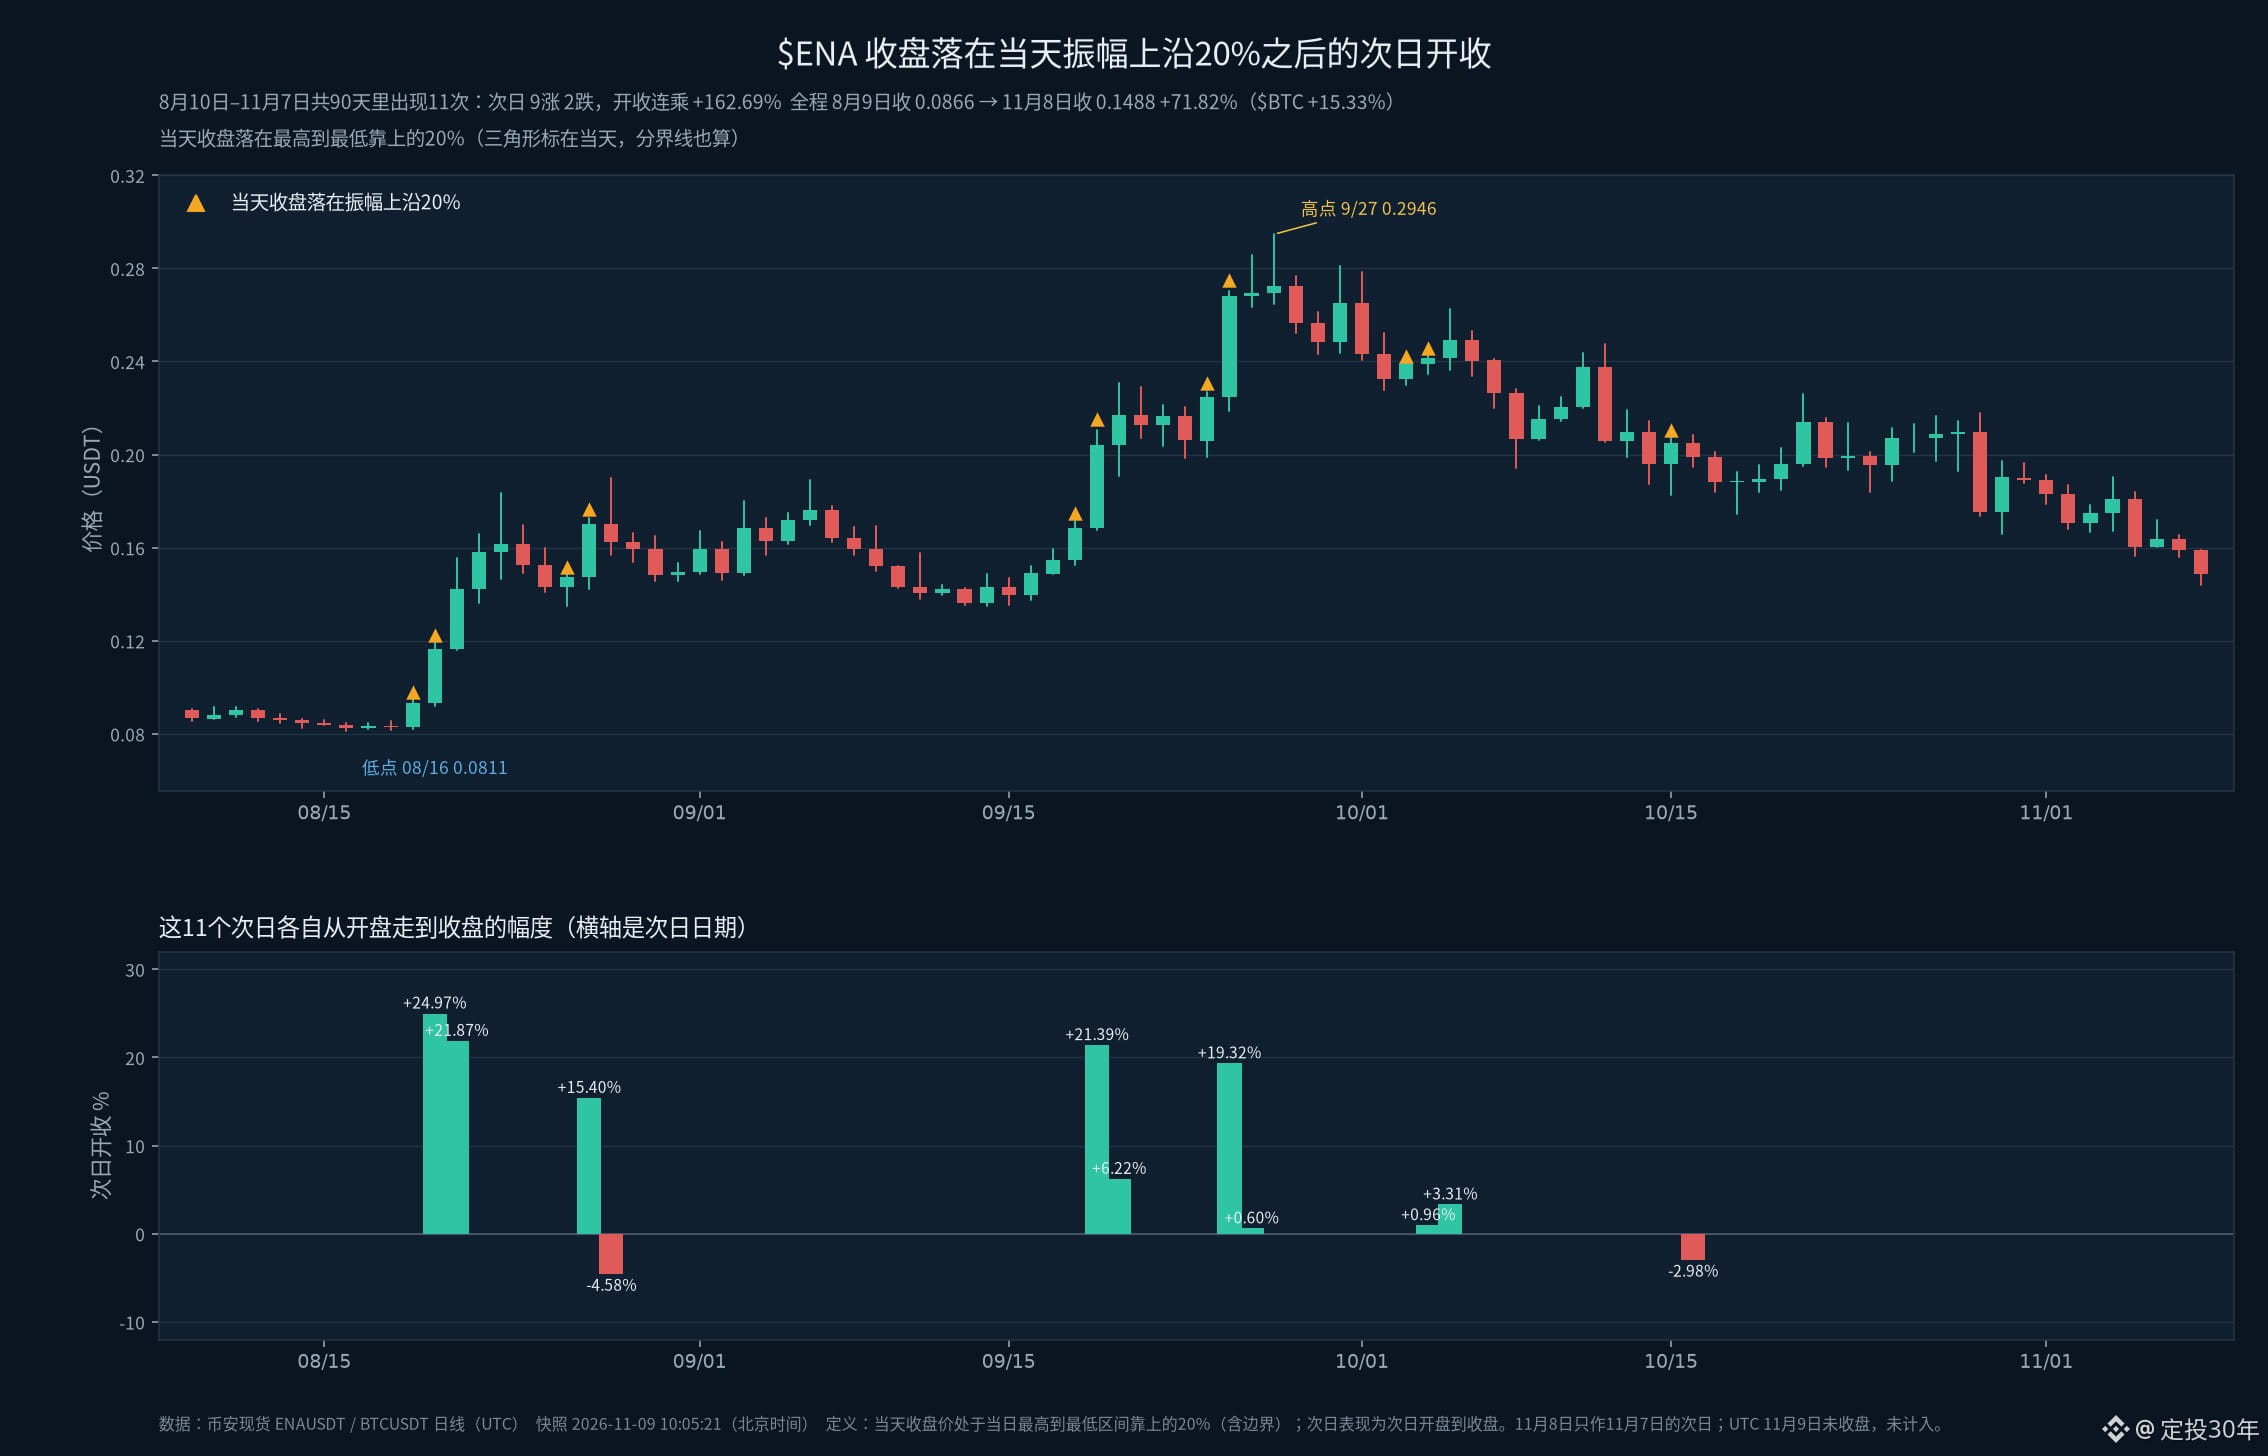
$ENA on Binance Spot, trading pair ENAUSDT, listed on the platform as Ethena. First, the price: on the completed daily candle for November 8 (UTC), the reference close was 0.0866 on August 9, and the November 8 close was 0.1488, up 71.82%. Over the same period, $BTC went from 64901.59 to 74851.44, up 15.33%. $ENA also surged higher in between: the intraday high was 0.2946 on September 27, which closed at 0.2725. The November 8 close was 49.49% below that high, and would need to rise 97.98% to get back there. The intraday low was 0.0811 on August 16, which closed at 0.0824.
I split the 90 days from August 10 to November 7 based on whether the daily close fell in the upper 20% of the day's high-to-low range. Each day that qualified counted as an event; the cutoff itself was included. I measured gains and losses on the following completed daily candle, from its open to its close. November 8 was used only as the day after November 7; it was not itself classified. The November 9 candle was still incomplete, so it was excluded.
Over the 90 days, 11 closed in the upper 20% of the day's range. Of the following 11 days, 9 closed above their opens and 2 below; the average was +9.68%, the median was +6.22%, and the compounded return across those 11 days was +162.69%. For the same 11 days, $BTC 's open-to-close compounded return was +12.20%, averaging +1.09%. The remaining 79 days did not close in the upper 20%. Of the 79 days that followed, 39 closed above their opens and 40 below; the average was -0.39%, the median was -0.60%, and the compounded return was -35.77%. Compounded across all 90 following days, the return was +68.74%.
All 11 event days themselves were up days: each closed above its open and near that day's high.
The biggest next-day open-to-close gain was on August 20. The classification day was August 19, when the price opened at 0.0828 and closed at 0.0933, with a high of 0.0952 and a low of 0.0821. The following day opened at 0.0933 and closed at 0.1166, up 24.97%, after reaching an intraday high of 0.1189. The biggest drop was on the following day, August 28, corresponding to the classification day of August 27, which closed at 0.1701. The next day opened at 0.1702 and closed at 0.1624, down 4.58%.
Two other moves were also substantial. August 20 itself also closed in the upper 20%; the next day, August 21, opened at 0.1166 and closed at 0.1421, up 21.87%, with an intraday high of 0.1555. On September 18, the close was 0.1684; the next day, September 19, opened at 0.1683 and closed at 0.2043, up 21.39%, with an intraday high of 0.2105.
Even excluding the biggest-gaining next day, 8 of the remaining 10 closed above their opens and 2 below; the average was +8.15%, and the compounded return was +110.20%. Excluding it here means counting that day as 0% in the compounded return, not assuming it could have been avoided at the time. The three biggest-gaining next days compounded to +84.88%; among the remaining 8 days, 6 closed above their opens and 2 below, for a compounded return of +42.08%. If all 11 next days had been counted as 0%, the remaining 79 next days would still have compounded to -35.77%.
These are just the results from splitting up this 90-day period. In this sample, after a close in the upper 20% of the day's range, the next day's open-to-close move was positive overall; after days that did not qualify, it was negative overall. These figures can't tell us what will happen the next time a candle closes near its high. When you watch $ENA , do you focus first on how close it closes to the day's high, or are you more concerned with how far the November 8 close was from the September 27 high?
I split the 90 days from August 10 to November 7 based on whether the daily close fell in the upper 20% of the day's high-to-low range. Each day that qualified counted as an event; the cutoff itself was included. I measured gains and losses on the following completed daily candle, from its open to its close. November 8 was used only as the day after November 7; it was not itself classified. The November 9 candle was still incomplete, so it was excluded.
Over the 90 days, 11 closed in the upper 20% of the day's range. Of the following 11 days, 9 closed above their opens and 2 below; the average was +9.68%, the median was +6.22%, and the compounded return across those 11 days was +162.69%. For the same 11 days, $BTC 's open-to-close compounded return was +12.20%, averaging +1.09%. The remaining 79 days did not close in the upper 20%. Of the 79 days that followed, 39 closed above their opens and 40 below; the average was -0.39%, the median was -0.60%, and the compounded return was -35.77%. Compounded across all 90 following days, the return was +68.74%.
All 11 event days themselves were up days: each closed above its open and near that day's high.
The biggest next-day open-to-close gain was on August 20. The classification day was August 19, when the price opened at 0.0828 and closed at 0.0933, with a high of 0.0952 and a low of 0.0821. The following day opened at 0.0933 and closed at 0.1166, up 24.97%, after reaching an intraday high of 0.1189. The biggest drop was on the following day, August 28, corresponding to the classification day of August 27, which closed at 0.1701. The next day opened at 0.1702 and closed at 0.1624, down 4.58%.
Two other moves were also substantial. August 20 itself also closed in the upper 20%; the next day, August 21, opened at 0.1166 and closed at 0.1421, up 21.87%, with an intraday high of 0.1555. On September 18, the close was 0.1684; the next day, September 19, opened at 0.1683 and closed at 0.2043, up 21.39%, with an intraday high of 0.2105.
Even excluding the biggest-gaining next day, 8 of the remaining 10 closed above their opens and 2 below; the average was +8.15%, and the compounded return was +110.20%. Excluding it here means counting that day as 0% in the compounded return, not assuming it could have been avoided at the time. The three biggest-gaining next days compounded to +84.88%; among the remaining 8 days, 6 closed above their opens and 2 below, for a compounded return of +42.08%. If all 11 next days had been counted as 0%, the remaining 79 next days would still have compounded to -35.77%.
These are just the results from splitting up this 90-day period. In this sample, after a close in the upper 20% of the day's range, the next day's open-to-close move was positive overall; after days that did not qualify, it was negative overall. These figures can't tell us what will happen the next time a candle closes near its high. When you watch $ENA , do you focus first on how close it closes to the day's high, or are you more concerned with how far the November 8 close was from the September 27 high?