Where the money is going—the clues are here:
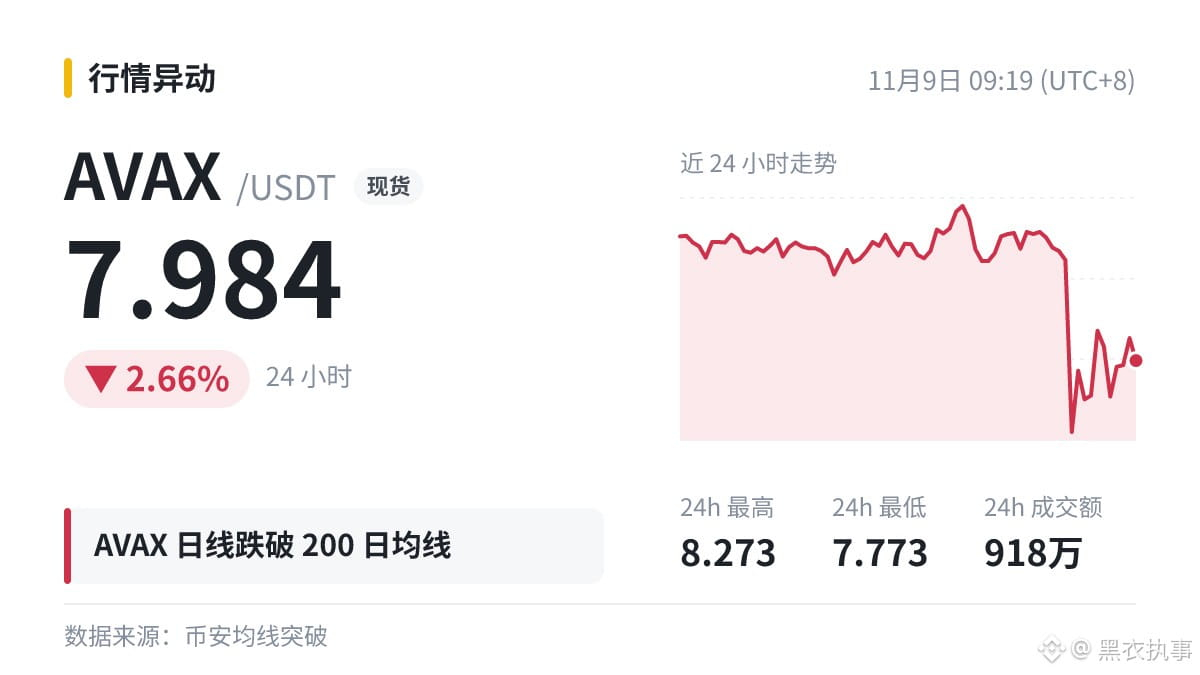
$AVAX The daily chart has fallen below MA200 (8.1191).
Many trend-following and quantitative investors watch these medium- to long-term moving averages. A break below them often triggers stop-losses and position cuts. Watch to see whether buyers step in at lower levels.
Do you think this is the beginning or the end?
#AVAX
$AVAX The daily chart has fallen below MA200 (8.1191).
Many trend-following and quantitative investors watch these medium- to long-term moving averages. A break below them often triggers stop-losses and position cuts. Watch to see whether buyers step in at lower levels.
Do you think this is the beginning or the end?
#AVAX