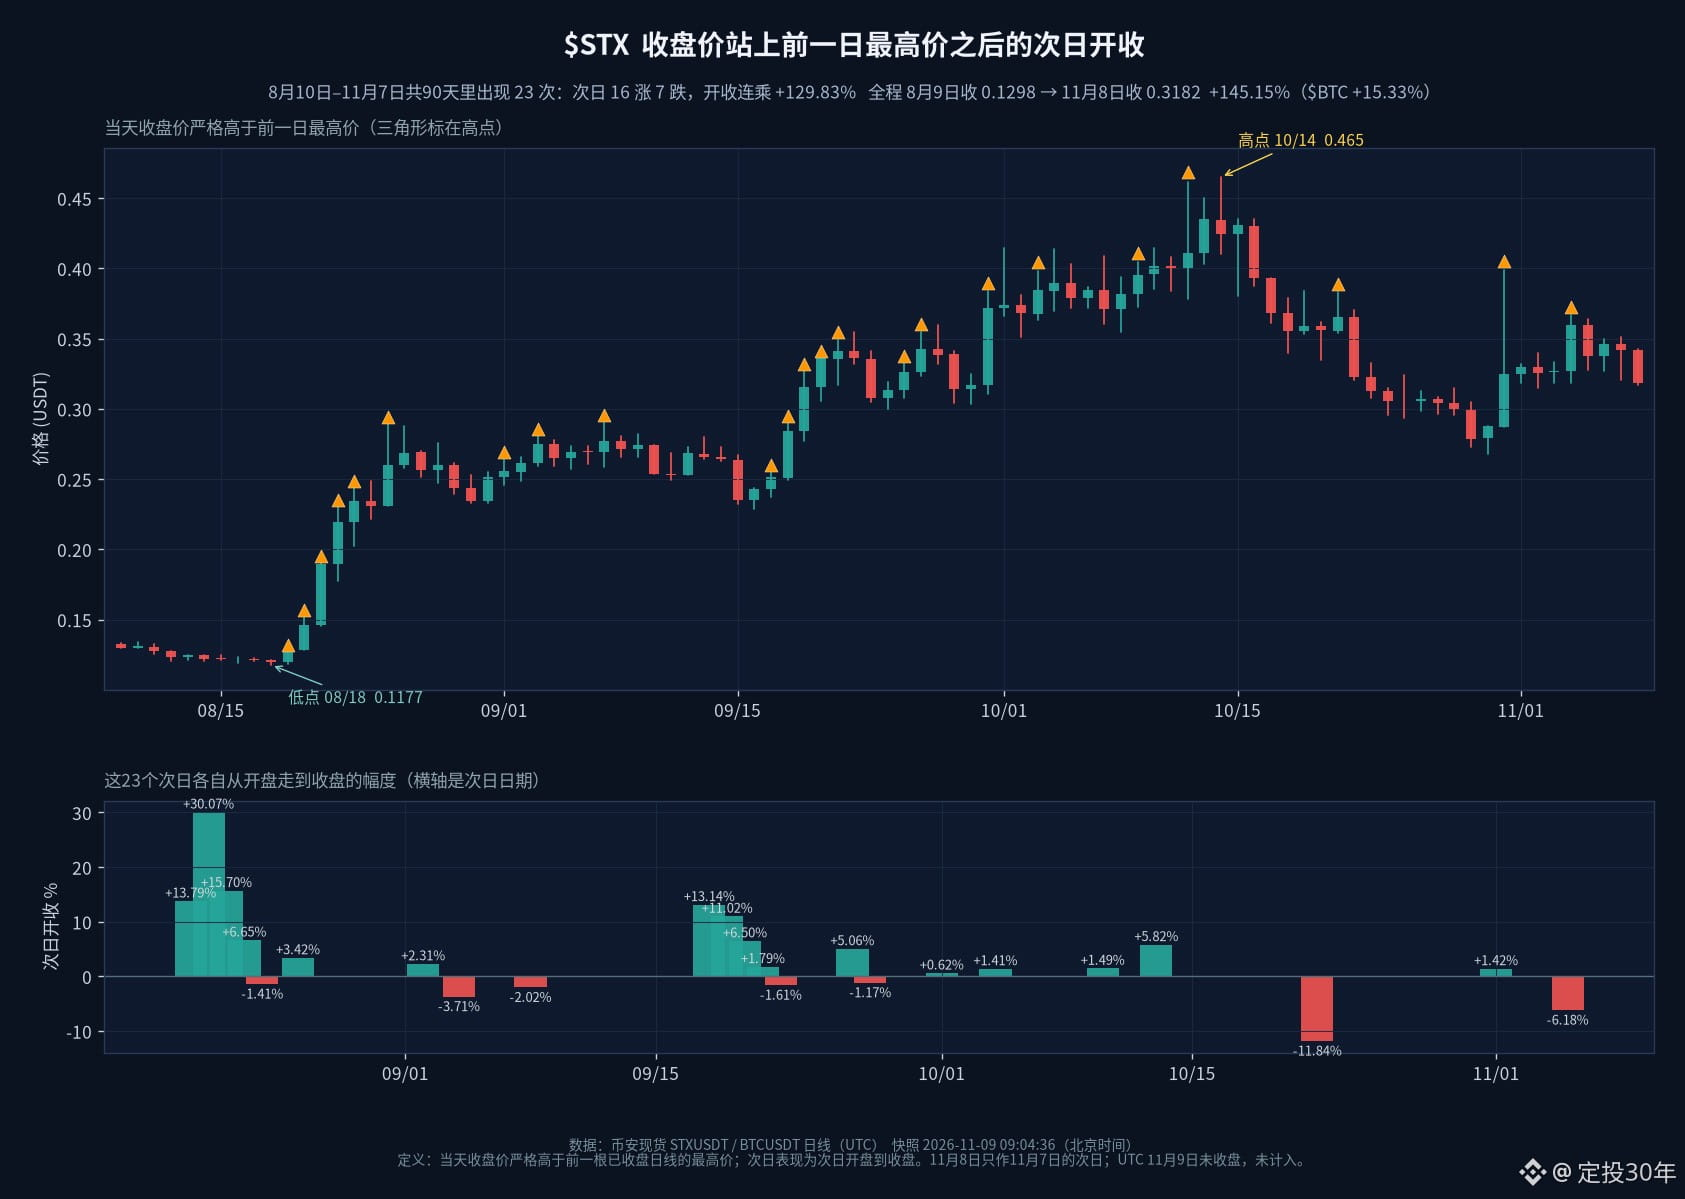
$STX on Binance Spot trades as STXUSDT, and the platform lists its name as Stacks. For price, let’s start with the completed daily candle for November 8 (UTC): the reference close was 0.1298 on August 9, and the November 8 close was 0.3182, up 145.15%. Over the same period, $BTC went from 64901.59 to 74851.44, up 15.33%. $STX also reached higher levels along the way: its intraday high was 0.465 on October 14, and it closed that day at 0.4242. The November 8 close was 31.57% below that high, and it would need to rise 46.13% to get back there. The intraday low was 0.1177 on August 18, and it closed that day at 0.12.
I split the 90 days from August 10 to November 7 according to whether the daily close was strictly above the previous completed daily candle’s high. Each close above the previous day’s high counts as an event. I measured the move on the following completed day, from open to close. November 8 is included only as the following day for November 7; it isn’t classified itself. Days that weren’t yet complete were excluded.
Over the 90 days, there were 23 closes above the previous day’s high. Of the 23 following days, 16 closed above their open and 7 closed below it. The average return was +4.01%, the median was +1.79%, and the compounded return across the 23 days was +129.83%. Over those same 23 following days, $BTC had a compounded open-to-close return of +23.24%, with an average of +0.96%. On the other 67 days, the close did not get above the previous day’s high. Of their 67 following days, 32 closed above their open and 35 closed below it. The average return was +0.22%, the median was -0.22%, and the compounded return across the 67 days was +6.48%. The compounded return across all 90 following days was +144.72%.
The biggest open-to-close gain on a following day was on August 21. The classification day was August 20, when the close was 0.1461, above the previous day’s high of 0.1298, which had been reached on August 19. The following day moved from an open of 0.146 to a close of 0.1899, up 30.07%, and reached an intraday high of 0.1926. The biggest loss on a following day was on October 22. The classification day was October 21, when the close was 0.3654, above the previous day’s high of 0.3618. The following day moved from an open of 0.3657 to a close of 0.3224, down 11.84%.
A few other instances are also worth a look. On August 21, the close was 0.1899, above the previous day’s high of 0.1542; the following day, August 22, went from 0.1898 to a close of 0.2196, up 15.70%. On August 19, the close was 0.1286, above the previous day’s high of 0.1214; the following day, August 20, went from 0.1284 to a close of 0.1461, up 13.79%. On September 17, the close was 0.2513, above the previous day’s high of 0.2439; the following day, September 18, went from 0.2511 to a close of 0.2841, up 13.14%.
Even if we exclude the biggest-gaining following day, the remaining 22 following days still had 15 closes above the open, 7 below it, and 1 counted as 0%. Their average return was +2.70%, and their compounded return was +76.70%. By “exclude,” I mean counting that day as 0% in the compounded return—not assuming it could have been avoided at the time. The three biggest-gaining following days had a compounded return of +71.24%; among the other 20, 13 closed above the open and 7 below it, for a compounded return of +34.22%. If all 23 following days had been counted as 0%, the other 67 following days still had a compounded return of +6.48%.
These are just the results from this 90-day sample. In this period, after a close above the previous day’s high, the following day generally moved upward from open to close. The days that didn’t break above the previous high also had a slight upward bias on the following day, but the move was much smaller. These figures can’t tell us what will happen the next time there’s a close above the previous high. When you watch $STX , do you first look at whether it closed above the previous day’s high, or are you more focused on how far it is from the October 14 high as of November 8?
I split the 90 days from August 10 to November 7 according to whether the daily close was strictly above the previous completed daily candle’s high. Each close above the previous day’s high counts as an event. I measured the move on the following completed day, from open to close. November 8 is included only as the following day for November 7; it isn’t classified itself. Days that weren’t yet complete were excluded.
Over the 90 days, there were 23 closes above the previous day’s high. Of the 23 following days, 16 closed above their open and 7 closed below it. The average return was +4.01%, the median was +1.79%, and the compounded return across the 23 days was +129.83%. Over those same 23 following days, $BTC had a compounded open-to-close return of +23.24%, with an average of +0.96%. On the other 67 days, the close did not get above the previous day’s high. Of their 67 following days, 32 closed above their open and 35 closed below it. The average return was +0.22%, the median was -0.22%, and the compounded return across the 67 days was +6.48%. The compounded return across all 90 following days was +144.72%.
The biggest open-to-close gain on a following day was on August 21. The classification day was August 20, when the close was 0.1461, above the previous day’s high of 0.1298, which had been reached on August 19. The following day moved from an open of 0.146 to a close of 0.1899, up 30.07%, and reached an intraday high of 0.1926. The biggest loss on a following day was on October 22. The classification day was October 21, when the close was 0.3654, above the previous day’s high of 0.3618. The following day moved from an open of 0.3657 to a close of 0.3224, down 11.84%.
A few other instances are also worth a look. On August 21, the close was 0.1899, above the previous day’s high of 0.1542; the following day, August 22, went from 0.1898 to a close of 0.2196, up 15.70%. On August 19, the close was 0.1286, above the previous day’s high of 0.1214; the following day, August 20, went from 0.1284 to a close of 0.1461, up 13.79%. On September 17, the close was 0.2513, above the previous day’s high of 0.2439; the following day, September 18, went from 0.2511 to a close of 0.2841, up 13.14%.
Even if we exclude the biggest-gaining following day, the remaining 22 following days still had 15 closes above the open, 7 below it, and 1 counted as 0%. Their average return was +2.70%, and their compounded return was +76.70%. By “exclude,” I mean counting that day as 0% in the compounded return—not assuming it could have been avoided at the time. The three biggest-gaining following days had a compounded return of +71.24%; among the other 20, 13 closed above the open and 7 below it, for a compounded return of +34.22%. If all 23 following days had been counted as 0%, the other 67 following days still had a compounded return of +6.48%.
These are just the results from this 90-day sample. In this period, after a close above the previous day’s high, the following day generally moved upward from open to close. The days that didn’t break above the previous high also had a slight upward bias on the following day, but the move was much smaller. These figures can’t tell us what will happen the next time there’s a close above the previous high. When you watch $STX , do you first look at whether it closed above the previous day’s high, or are you more focused on how far it is from the October 14 high as of November 8?