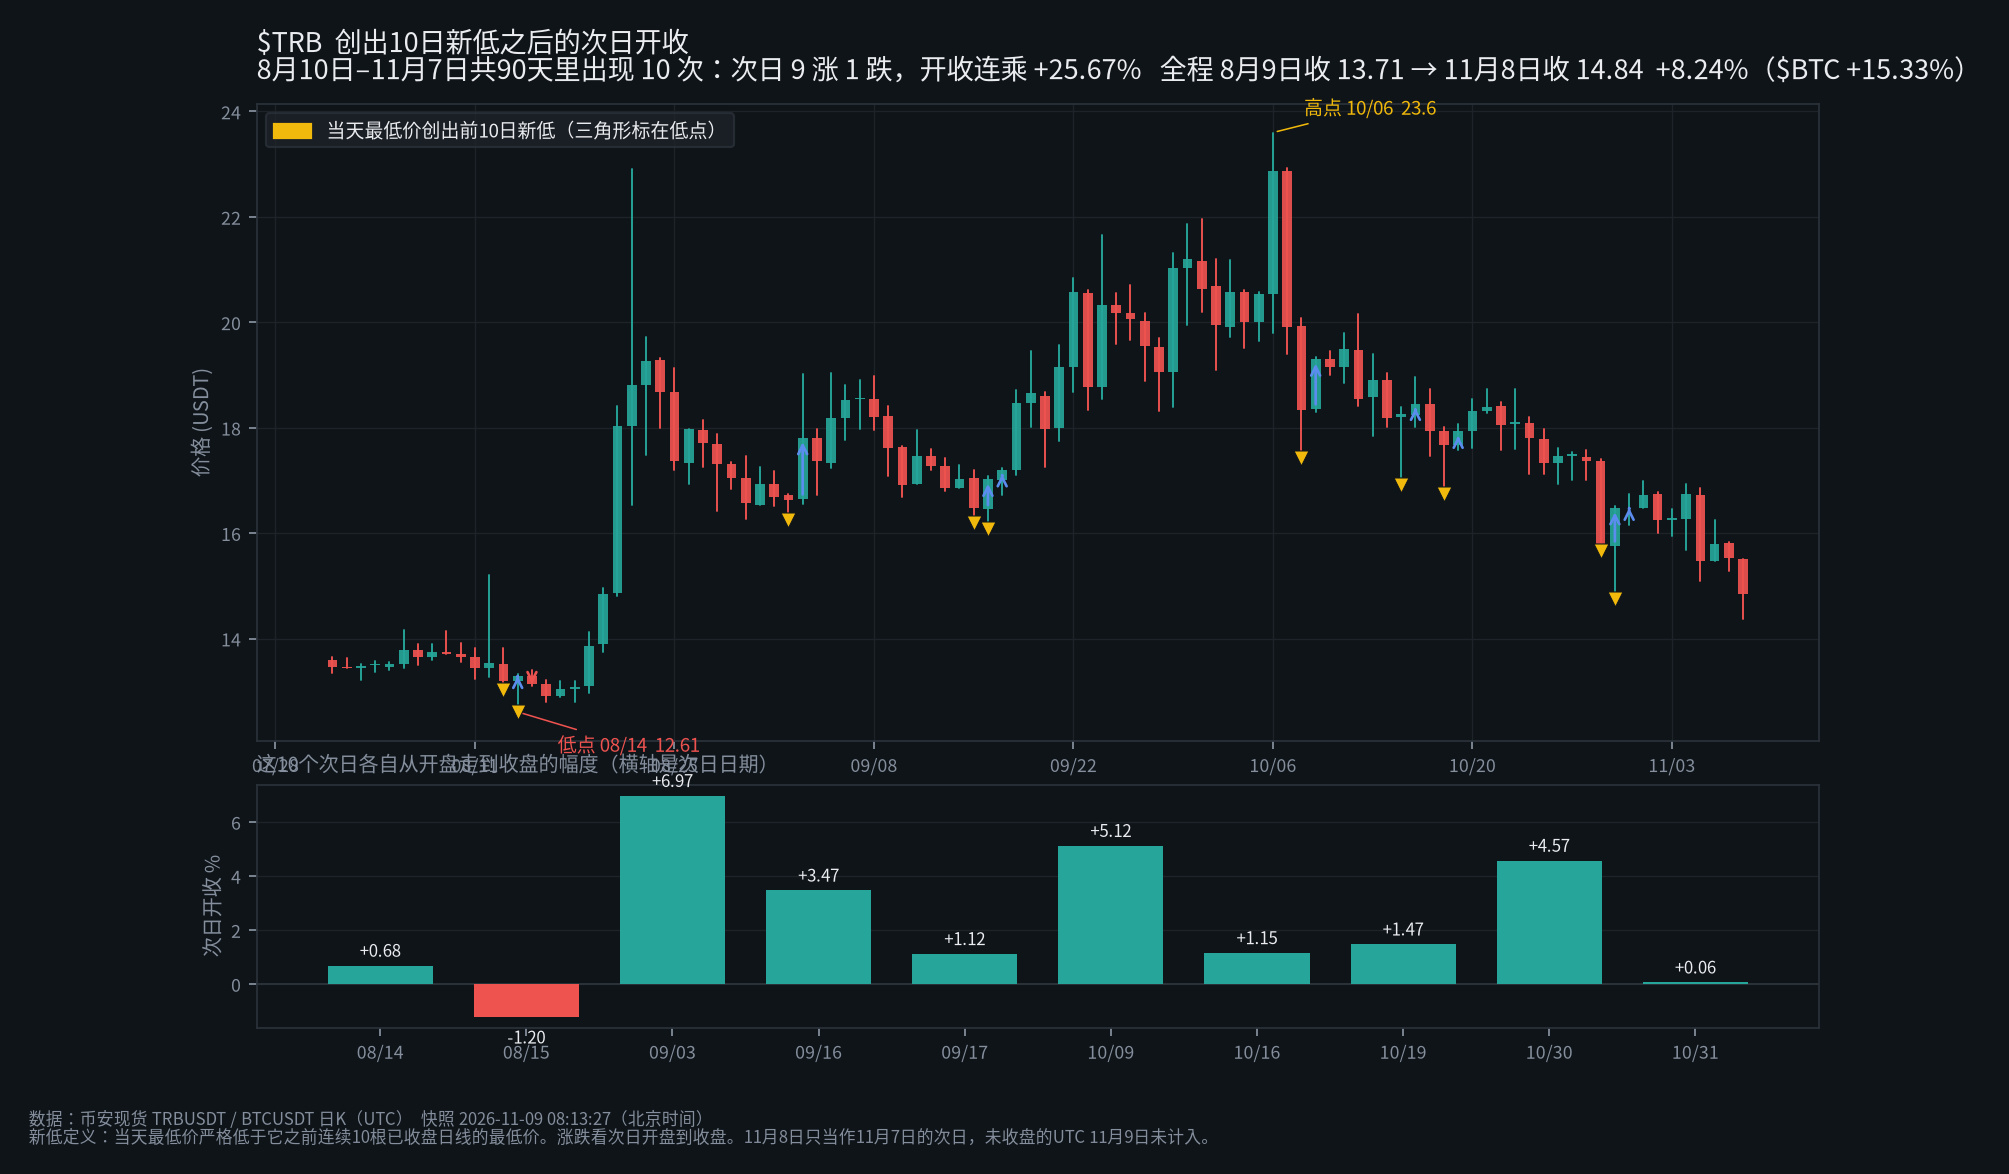
$TRB on Binance Spot trades under the TRBUSDT pair, and the platform lists its name as Tellor Tributes. For the price, start with the completed daily candle for November 8 (UTC): the reference close was 13.71 on August 9, and the November 8 close was 14.84, up 8.24%. Over the same period, $BTC went from 64901.59 to 74851.44, up 15.33%. $TRB also surged higher in between: its intraday high was 23.6 on October 6, and it closed that day at 22.87. The November 8 close was 37.12% below that high, and it would need to rise 59.03% to get back there. The intraday low was 12.61 on August 14, and it closed that day at 13.29.
I split the 90 days from August 10 to November 7 based on whether that day’s low fell below the lows of the 10 consecutive completed daily candles before it. A day that set this kind of 10-day low counted as an event. I measured the move on the next completed day, from open to close. November 8 was used only as the next day for November 7; it was not classified itself. Later days that had not yet completed were not included.
Over the 90 days, 10 set this kind of 10-day low. Of the 10 following days, 9 closed above their opens and 1 closed below; the average return was +2.34%, the median was +1.31%, and the compounded return across the 10 days was +25.67%. For the same 10 days, $BTC had a compounded open-to-close return of +5.01%, with an average of +0.50%. The other 80 days did not set a 10-day low. Of their following 80 days, 36 closed above their opens, 43 closed below, and 1 was flat. The average return was -0.07%, the median was -0.69%, and the compounded return across the 80 days was -13.35%. Compounded together, all 90 following days returned +8.89%.
The biggest next-day open-to-close gain was on September 3. The classification day was September 2, when the low of 16.25 fell below the prior 10-day low of 16.27, set on August 30. The next day rose from an open of 16.65 to a close of 17.81, up 6.97%, and reached an intraday high of 19.02. The only next day that fell was August 15. The classification day was August 14, when the low of 12.61—the lowest intraday price in this window—fell below the prior 10-day low of 13.03, set on August 13. The next day went from an open of 13.3 to a close of 13.14, down 1.20%.
Most of the other instances also closed above their opens. The October 8 low was 17.42; the next day, October 9, rose from 18.36 to a close of 19.3, up 5.12%. The October 29 low was 15.67; the next day, October 30, rose from 15.76 to a close of 16.48, up 4.57%. The August 13 low was 13.03; the next day, August 14, rose from 13.2 to a close of 13.29, up 0.68%. The October 30 low fell further, to 14.75; the next day, October 31, went from 16.47 to a close of 16.48, up just 0.06%.
Even excluding the biggest-gaining next day, 8 of the remaining 9 days still closed above their opens and 1 closed below. The average return was +1.83%, and the compounded return was +17.48%. By “excluding” it, I mean counting that day as 0% in the compounding—not assuming it could have been avoided at the time. The three biggest-gaining next days compounded to +17.58%; among the other 7 days, 6 closed above their opens and 1 closed below, with a compounded return of +6.88%. If all 10 next days are counted as 0%, the other 80 next days still compound to -13.35%.
These are just the results from this 90-day period. In this sample, after a 10-day low, the next day generally moved up from open to close; after days that did not set a new low, the overall direction was slightly down. These figures cannot tell us what will happen the next time a 10-day low occurs. When you watch $TRB , do you first look for a new low against the past 10 days, or are you more focused on how far the November 8 price is from the October 6 high?
I split the 90 days from August 10 to November 7 based on whether that day’s low fell below the lows of the 10 consecutive completed daily candles before it. A day that set this kind of 10-day low counted as an event. I measured the move on the next completed day, from open to close. November 8 was used only as the next day for November 7; it was not classified itself. Later days that had not yet completed were not included.
Over the 90 days, 10 set this kind of 10-day low. Of the 10 following days, 9 closed above their opens and 1 closed below; the average return was +2.34%, the median was +1.31%, and the compounded return across the 10 days was +25.67%. For the same 10 days, $BTC had a compounded open-to-close return of +5.01%, with an average of +0.50%. The other 80 days did not set a 10-day low. Of their following 80 days, 36 closed above their opens, 43 closed below, and 1 was flat. The average return was -0.07%, the median was -0.69%, and the compounded return across the 80 days was -13.35%. Compounded together, all 90 following days returned +8.89%.
The biggest next-day open-to-close gain was on September 3. The classification day was September 2, when the low of 16.25 fell below the prior 10-day low of 16.27, set on August 30. The next day rose from an open of 16.65 to a close of 17.81, up 6.97%, and reached an intraday high of 19.02. The only next day that fell was August 15. The classification day was August 14, when the low of 12.61—the lowest intraday price in this window—fell below the prior 10-day low of 13.03, set on August 13. The next day went from an open of 13.3 to a close of 13.14, down 1.20%.
Most of the other instances also closed above their opens. The October 8 low was 17.42; the next day, October 9, rose from 18.36 to a close of 19.3, up 5.12%. The October 29 low was 15.67; the next day, October 30, rose from 15.76 to a close of 16.48, up 4.57%. The August 13 low was 13.03; the next day, August 14, rose from 13.2 to a close of 13.29, up 0.68%. The October 30 low fell further, to 14.75; the next day, October 31, went from 16.47 to a close of 16.48, up just 0.06%.
Even excluding the biggest-gaining next day, 8 of the remaining 9 days still closed above their opens and 1 closed below. The average return was +1.83%, and the compounded return was +17.48%. By “excluding” it, I mean counting that day as 0% in the compounding—not assuming it could have been avoided at the time. The three biggest-gaining next days compounded to +17.58%; among the other 7 days, 6 closed above their opens and 1 closed below, with a compounded return of +6.88%. If all 10 next days are counted as 0%, the other 80 next days still compound to -13.35%.
These are just the results from this 90-day period. In this sample, after a 10-day low, the next day generally moved up from open to close; after days that did not set a new low, the overall direction was slightly down. These figures cannot tell us what will happen the next time a 10-day low occurs. When you watch $TRB , do you first look for a new low against the past 10 days, or are you more focused on how far the November 8 price is from the October 6 high?