$ETH Daily chart: The moving averages are perfectly aligned bearishly. Price is below EMA15 at 2295, EMA30 at 2354, EMA60 at 2382, and EMA120 at 2324. Both MACD lines are deeply negative, with an early bullish divergence and golden cross forming. Bollinger Band width is narrowing; the middle band at 2317 is dynamic resistance, and the lower band at 2166 is key support. The TD count is at 4; no reversal has been completed. Price has retraced approximately 20.3% from the high of 2806.76.
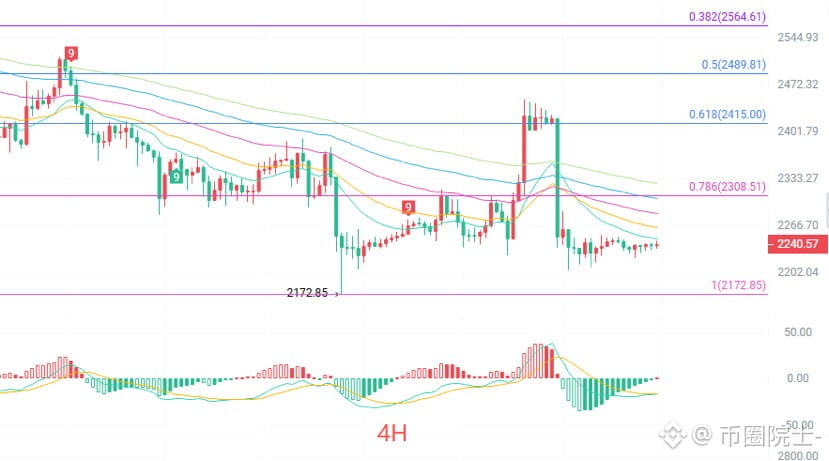
On the four-hour chart, EMA15 at 2248 is immediate resistance, while EMA30/60/90/120 are bearishly fanned out. The weak bullish MACD crossover below the zero line lacks momentum. The rebound to 2410 met confluence resistance from EMA90–120 and then pulled back. Daily support at 2166 and the four-hour Bollinger lower band at 2168 form confluence support across timeframes.
Long strategy: If a bullish engulfing pattern appears on a retest of 2172–2168, enter at 2170–2175, place a stop at 2155, and target 2248-2295-2317. Risk-reward ratio: 1:2.5.
Short strategy: If a shooting star appears on a rebound to 2295–2317, enter at 2300–2310, place a stop at 2330, and target 2248-2172. Risk-reward ratio: 1:3.5. Risk per trade should be less than 2% of net assets.
Technical analysis is about managing probabilities, not making predictions. The above is for personal review only and does not constitute investment advice. Follow along and stay disciplined.
#ETH走势分析
On the four-hour chart, EMA15 at 2248 is immediate resistance, while EMA30/60/90/120 are bearishly fanned out. The weak bullish MACD crossover below the zero line lacks momentum. The rebound to 2410 met confluence resistance from EMA90–120 and then pulled back. Daily support at 2166 and the four-hour Bollinger lower band at 2168 form confluence support across timeframes.
Long strategy: If a bullish engulfing pattern appears on a retest of 2172–2168, enter at 2170–2175, place a stop at 2155, and target 2248-2295-2317. Risk-reward ratio: 1:2.5.
Short strategy: If a shooting star appears on a rebound to 2295–2317, enter at 2300–2310, place a stop at 2330, and target 2248-2172. Risk-reward ratio: 1:3.5. Risk per trade should be less than 2% of net assets.
Technical analysis is about managing probabilities, not making predictions. The above is for personal review only and does not constitute investment advice. Follow along and stay disciplined.
#ETH走势分析