🚨 Did the market lie to us? What nobody tells you about Bitcoin’s liquidation map 📉👀
Did you think I was gone for good, right, fan? 🦇 I’m back in action because what Bitcoin is cooking up on the charts right now is not something to sleep on. If you’re trading blind this weekend, you’re giving your money away.
Let’s take a quick look at what’s happened in the market all this time and where the compass is pointing:
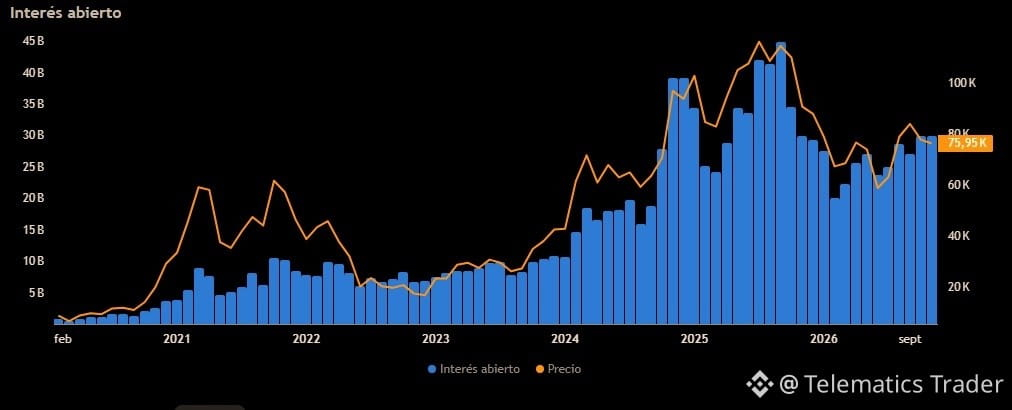
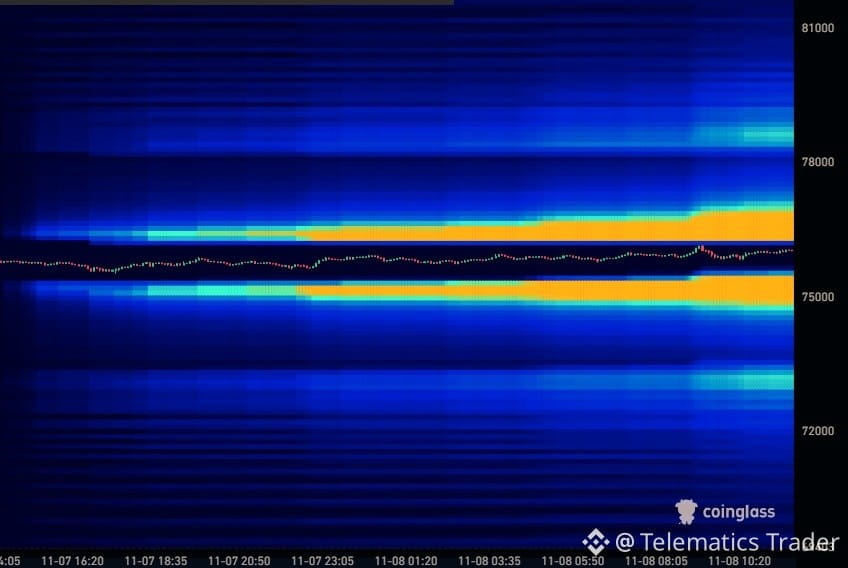
1️⃣ Open Interest cooled off, but the trap is set: We went from Open Interest hovering near $40B in the glory days to a more conservative range of $25B to $30B today. Less retail noise, but watch out: Coinglass’s heatmap shows a massive buildup of liquidity (yellow bands) right around $75K below and $78K above.
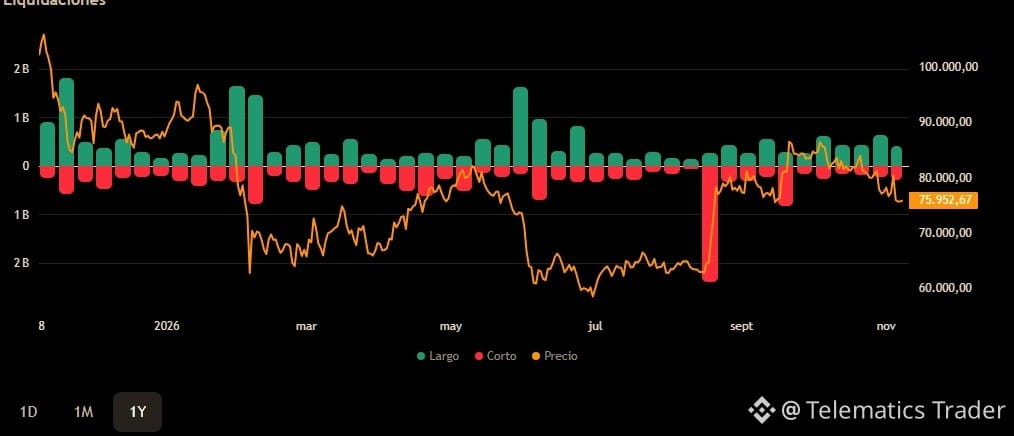
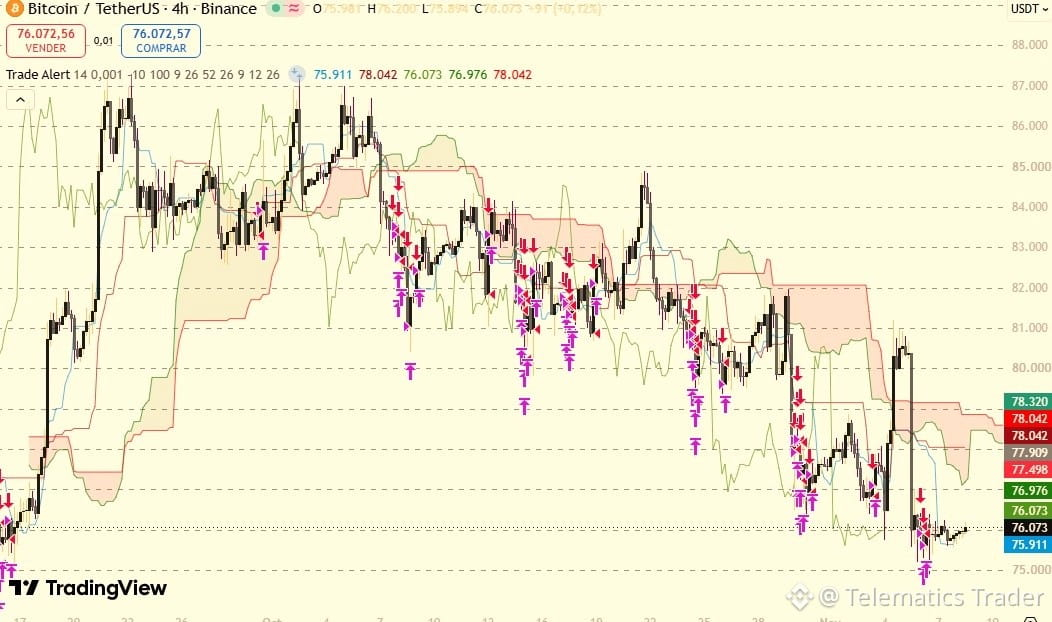
2️⃣ The leveraged traders’ massacre: 2026 has shown no mercy. Between the savage long liquidations we saw midyear and institutional rejection on the 4H timeframes as they tested the $76K zone, the market has been shaking out the tourists.
3️⃣ What should we expect now? We’re on the verge of a squeeze. The current price compression is like a mechanical spring: they’re going to sweep the leveraged traders’ stops on one side before making the real move in November.
Are you accumulating strategically or waiting for the crash? I’m reading your comments below. 👇🔥
#Bitcoin #BinanceSquare #cryptotrading #BTC #AnalisisTecnico
Did you think I was gone for good, right, fan? 🦇 I’m back in action because what Bitcoin is cooking up on the charts right now is not something to sleep on. If you’re trading blind this weekend, you’re giving your money away.
Let’s take a quick look at what’s happened in the market all this time and where the compass is pointing:
1️⃣ Open Interest cooled off, but the trap is set: We went from Open Interest hovering near $40B in the glory days to a more conservative range of $25B to $30B today. Less retail noise, but watch out: Coinglass’s heatmap shows a massive buildup of liquidity (yellow bands) right around $75K below and $78K above.
2️⃣ The leveraged traders’ massacre: 2026 has shown no mercy. Between the savage long liquidations we saw midyear and institutional rejection on the 4H timeframes as they tested the $76K zone, the market has been shaking out the tourists.
3️⃣ What should we expect now? We’re on the verge of a squeeze. The current price compression is like a mechanical spring: they’re going to sweep the leveraged traders’ stops on one side before making the real move in November.
Are you accumulating strategically or waiting for the crash? I’m reading your comments below. 👇🔥
#Bitcoin #BinanceSquare #cryptotrading #BTC #AnalisisTecnico