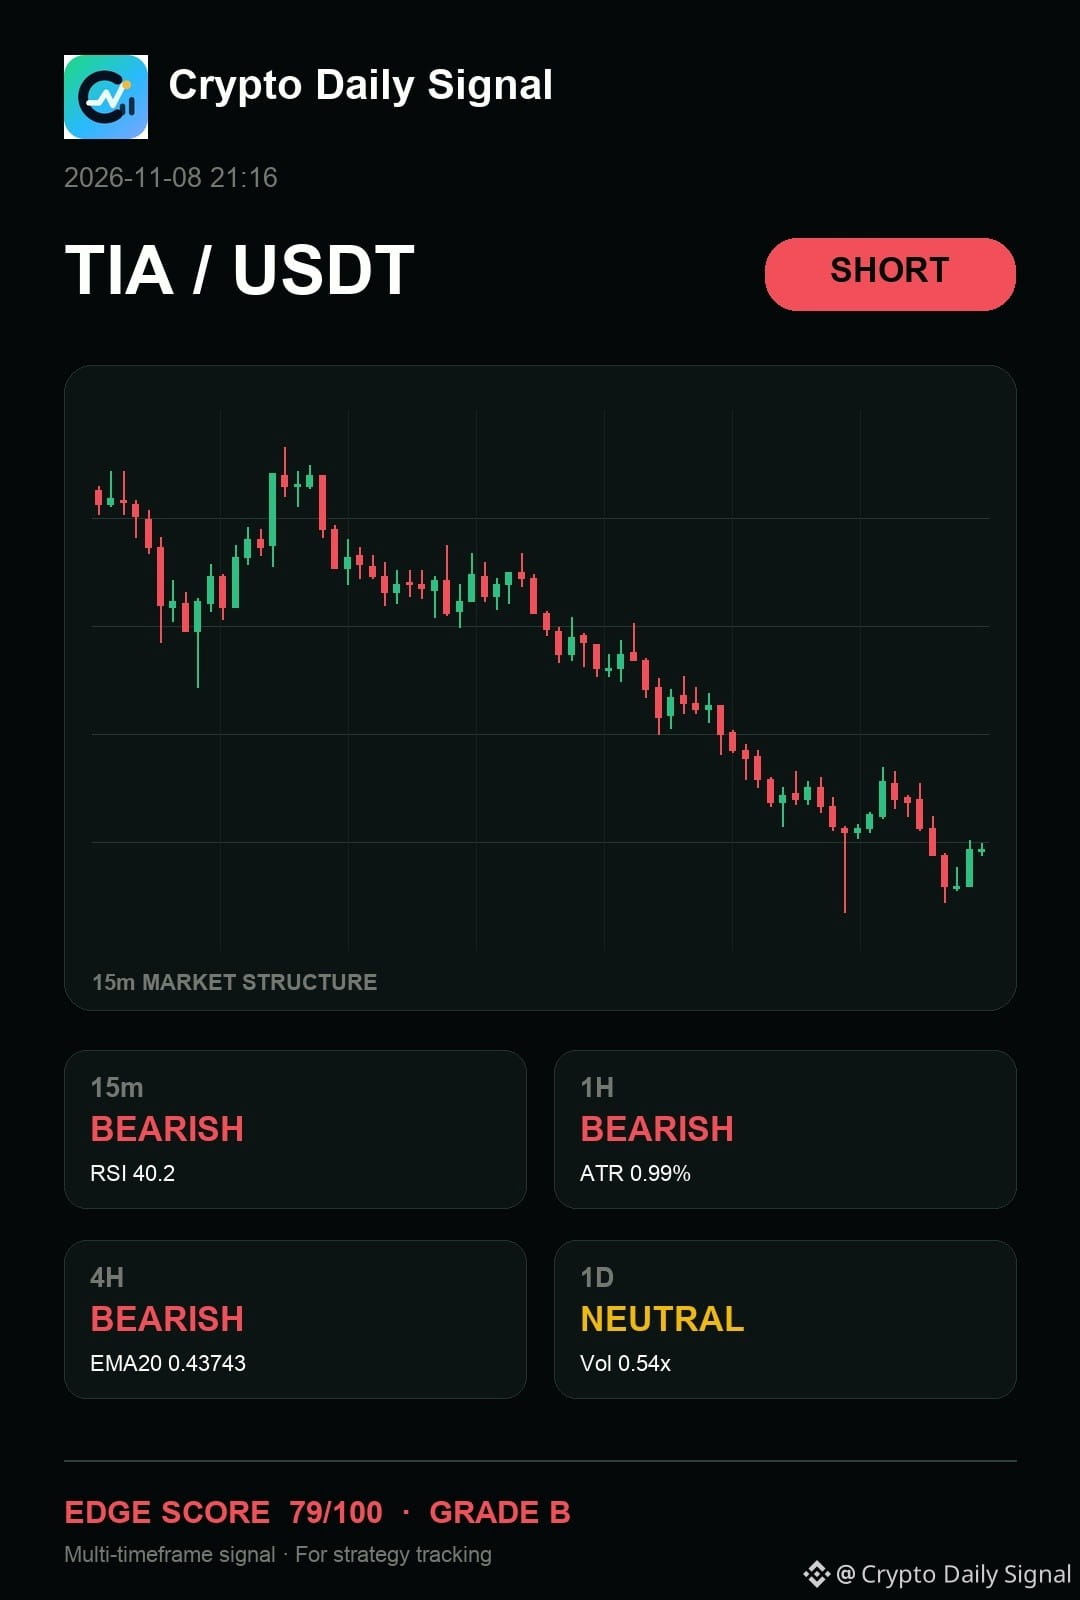
$TIA — honestly, the chart still says it still offers the cleaner bearish argument because the price action is displaying lower highs and lower lows across the recent trading period. This negative sequence aligns with the four-hour chart's down bias. A decisive break below the support from the last swing low would confirm the bearish expectation.
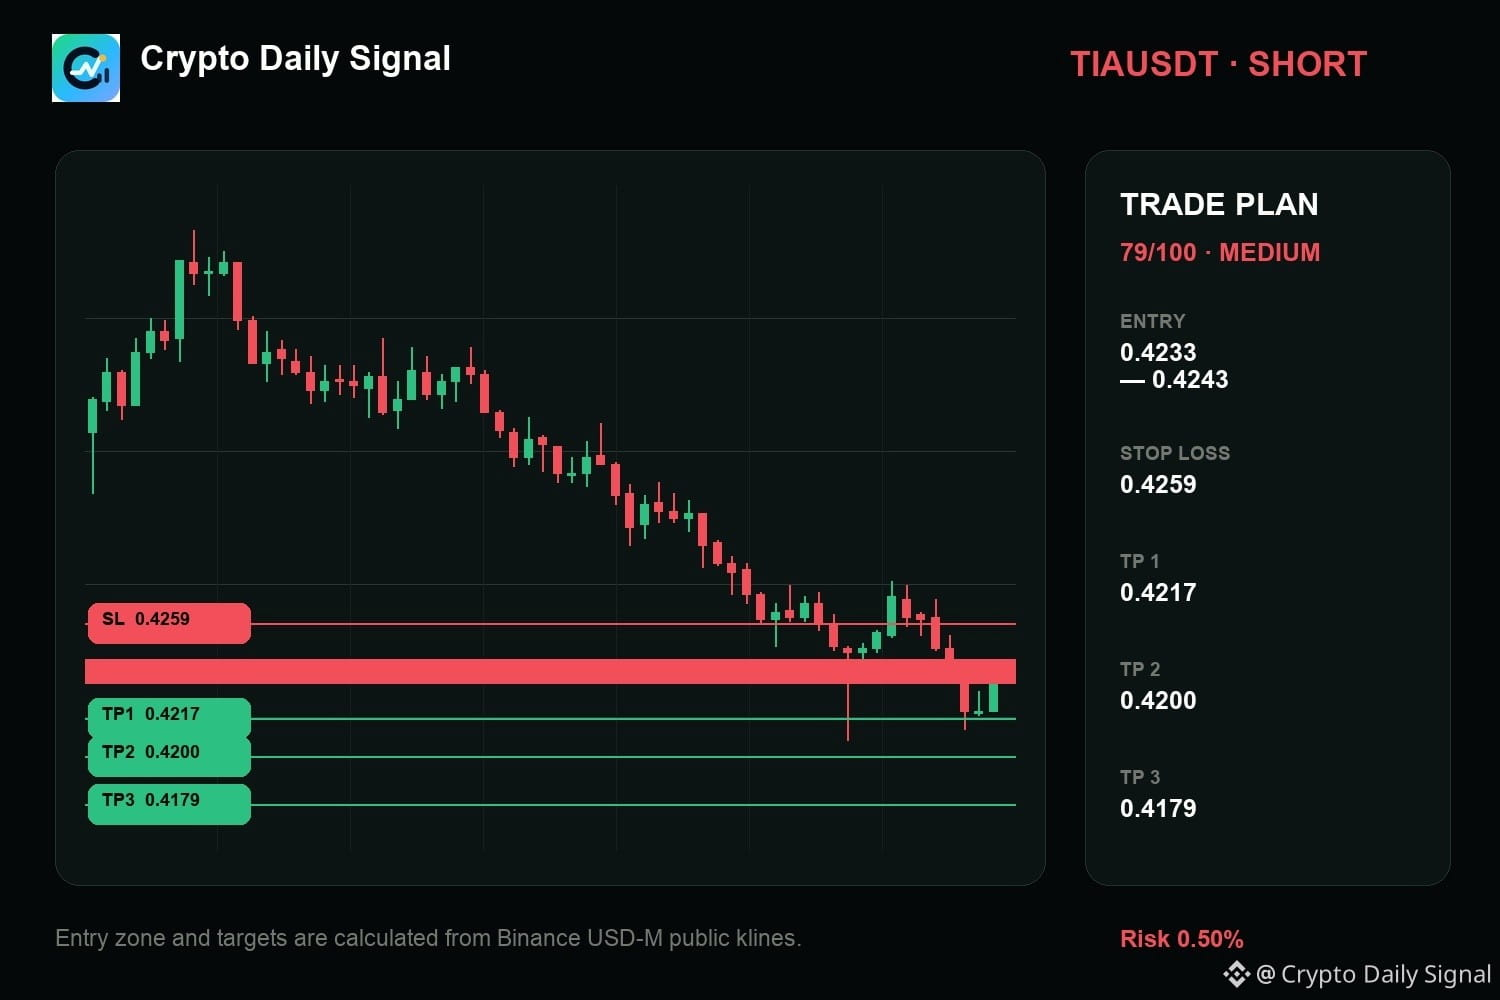
Levels — TIAUSDT
Zone: 0.4233 - 0.4243
Cut: 0.4259
Scale: 0.4217 | 0.4200 | 0.4179
#Futures
Levels — TIAUSDT
Zone: 0.4233 - 0.4243
Cut: 0.4259
Scale: 0.4217 | 0.4200 | 0.4179
#Futures