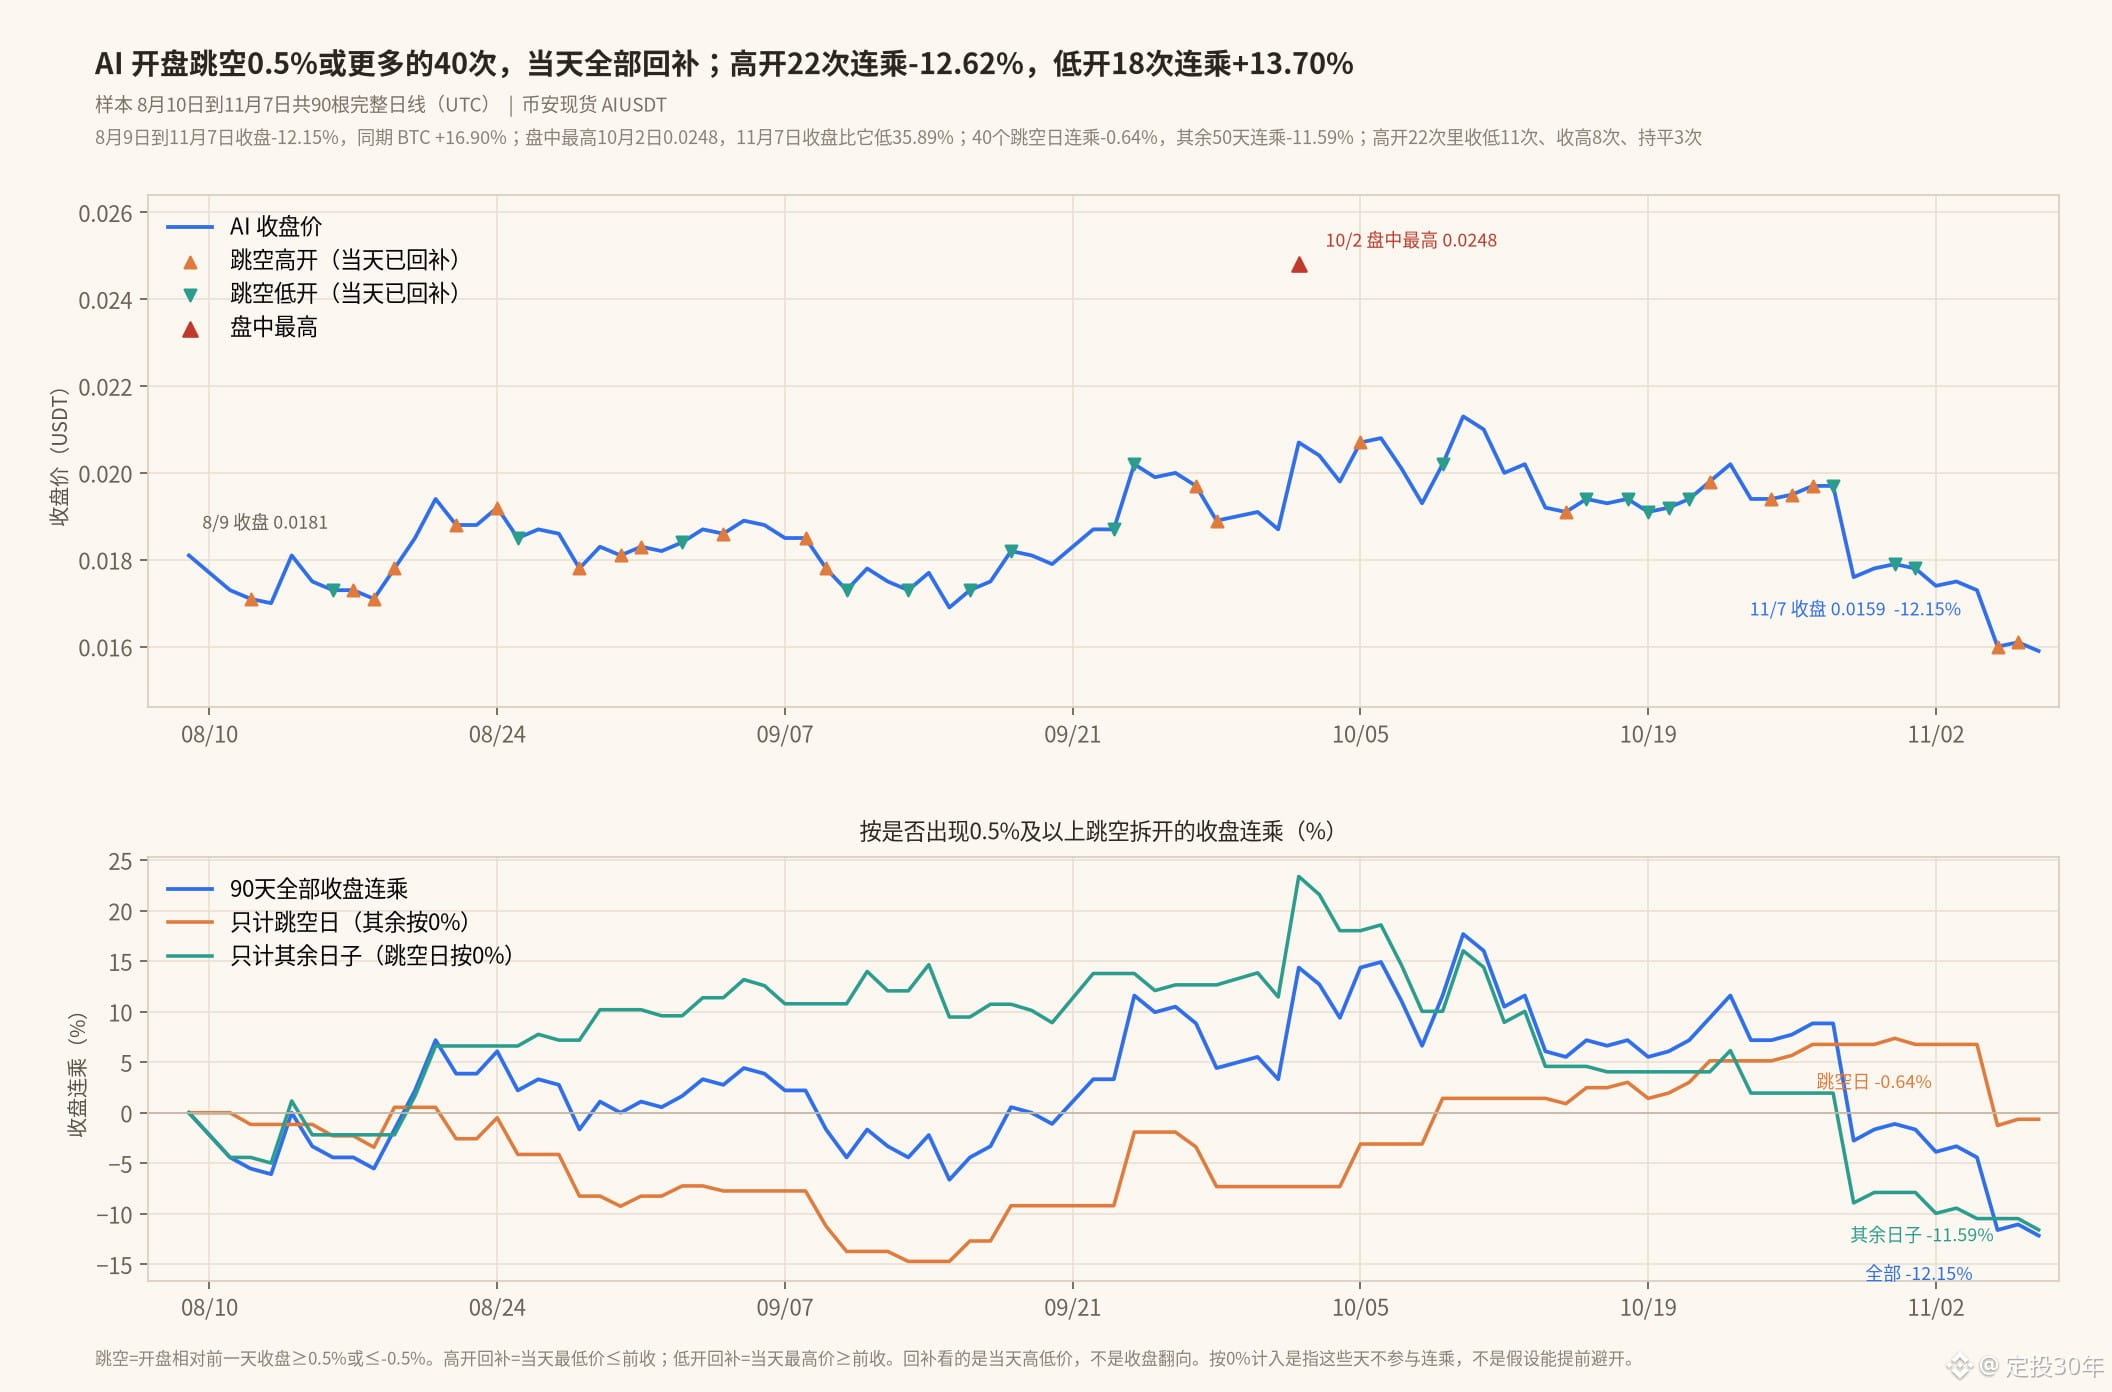
Looking at Binance spot $AI on the chart over this recent period: the sample covers 90 complete daily candles (UTC), from August 10 to November 7. Before these 90 days began, the August 9 close was 0.0181; on November 7, it closed at 0.0159, down 12.15%. Over the same period, $BTC went from 64901.59 to 75867.59, up 16.90%. $AI did surge higher in between: its intraday high was 0.0248 on October 2, and it closed that day at 0.0207. The November 7 close was 35.89% below that high, and would need to rise 55.97% to get back there. Its intraday low was also 0.0159, a price it touched on three consecutive days, from November 5 to November 7.
I counted gaps based on the open relative to the previous day's close. If the day's open was at least 0.5% above the previous day's close, I counted it as a gap up; if it was at least 0.5% below, I counted it as a gap down. After a gap up, it counted as filled if the day's low touched or fell below the previous day's close. After a gap down, it counted as filled if the day's high touched or rose above the previous day's close. The fill is based on that day's own high and low; there's no need to wait until the next day. The November 8 candle is still incomplete, so it isn't included.
There were 40 such gaps during these 90 days: 22 gap ups and 18 gap downs, and all 40 were filled on the same day. Most of these gaps were only a little over 0.5%: the 22 gap ups averaged +0.54%, and the 18 gap downs averaged -0.57%. The only gap larger than 1% was on October 21: the previous day closed at 0.0192, and the day opened at 0.019, down 1.04%. The day's high reached 0.0198, filling the gap, and it closed at 0.0194, up 1.04%. The most recent gap was on November 6: the previous day closed at 0.016, and the day opened at 0.0161, up 0.63%. The low reached 0.0159, filling the gap, and it closed at 0.0161, up 0.63% from the previous close.
A gap being filled only means that the day's high or low crossed the previous close; it doesn't mean the market reversed by the close. Although all 22 gap ups were filled, 8 closed above the previous day's close, 11 closed lower, and 3 were unchanged. The average return for those 22 days was -0.57%, and the compounded return was -12.62%. Of the 18 gap-down days, 6 still closed below the previous day's close, 10 closed higher, and 2 were unchanged. The average return for those 18 days was +0.75%, and the compounded return was +13.70%. Across all 40 gap days, the average return was +0.02%, and the compounded return was -0.64%. If the closing returns on those 40 days are all treated as 0%, the other 50 days had a compounded return of -11.59%. Overall, the 90-day closing return was -12.15%; 40 days closed above the previous day's close, 44 closed lower, and 6 were unchanged.
The worst close after a gap up was on November 5: the previous day closed at 0.0173, and the day opened at 0.0174, up 0.58%. The low fell to 0.0159, and it closed at 0.016, down 7.51%. The best close after a gap down was on September 24: the previous day closed at 0.0187, and the day opened at 0.0186, down 0.53%. The high reached 0.0218, and it closed at 0.0202, up 8.02%.
These 40 instances are observations from a 90-day period. They only show that during this period, after the open gapped by 0.5%, the day's high or low crossed back over the previous close. They don't mean the next gap will necessarily be filled, nor do they mean gap ups must fall or gap downs must rise. When you see an opening gap like this on $AI , do you wait to see whether it fills the previous close, or do you care more about which side of the previous close it ends up on at the end of the day?
I counted gaps based on the open relative to the previous day's close. If the day's open was at least 0.5% above the previous day's close, I counted it as a gap up; if it was at least 0.5% below, I counted it as a gap down. After a gap up, it counted as filled if the day's low touched or fell below the previous day's close. After a gap down, it counted as filled if the day's high touched or rose above the previous day's close. The fill is based on that day's own high and low; there's no need to wait until the next day. The November 8 candle is still incomplete, so it isn't included.
There were 40 such gaps during these 90 days: 22 gap ups and 18 gap downs, and all 40 were filled on the same day. Most of these gaps were only a little over 0.5%: the 22 gap ups averaged +0.54%, and the 18 gap downs averaged -0.57%. The only gap larger than 1% was on October 21: the previous day closed at 0.0192, and the day opened at 0.019, down 1.04%. The day's high reached 0.0198, filling the gap, and it closed at 0.0194, up 1.04%. The most recent gap was on November 6: the previous day closed at 0.016, and the day opened at 0.0161, up 0.63%. The low reached 0.0159, filling the gap, and it closed at 0.0161, up 0.63% from the previous close.
A gap being filled only means that the day's high or low crossed the previous close; it doesn't mean the market reversed by the close. Although all 22 gap ups were filled, 8 closed above the previous day's close, 11 closed lower, and 3 were unchanged. The average return for those 22 days was -0.57%, and the compounded return was -12.62%. Of the 18 gap-down days, 6 still closed below the previous day's close, 10 closed higher, and 2 were unchanged. The average return for those 18 days was +0.75%, and the compounded return was +13.70%. Across all 40 gap days, the average return was +0.02%, and the compounded return was -0.64%. If the closing returns on those 40 days are all treated as 0%, the other 50 days had a compounded return of -11.59%. Overall, the 90-day closing return was -12.15%; 40 days closed above the previous day's close, 44 closed lower, and 6 were unchanged.
The worst close after a gap up was on November 5: the previous day closed at 0.0173, and the day opened at 0.0174, up 0.58%. The low fell to 0.0159, and it closed at 0.016, down 7.51%. The best close after a gap down was on September 24: the previous day closed at 0.0187, and the day opened at 0.0186, down 0.53%. The high reached 0.0218, and it closed at 0.0202, up 8.02%.
These 40 instances are observations from a 90-day period. They only show that during this period, after the open gapped by 0.5%, the day's high or low crossed back over the previous close. They don't mean the next gap will necessarily be filled, nor do they mean gap ups must fall or gap downs must rise. When you see an opening gap like this on $AI , do you wait to see whether it fills the previous close, or do you care more about which side of the previous close it ends up on at the end of the day?