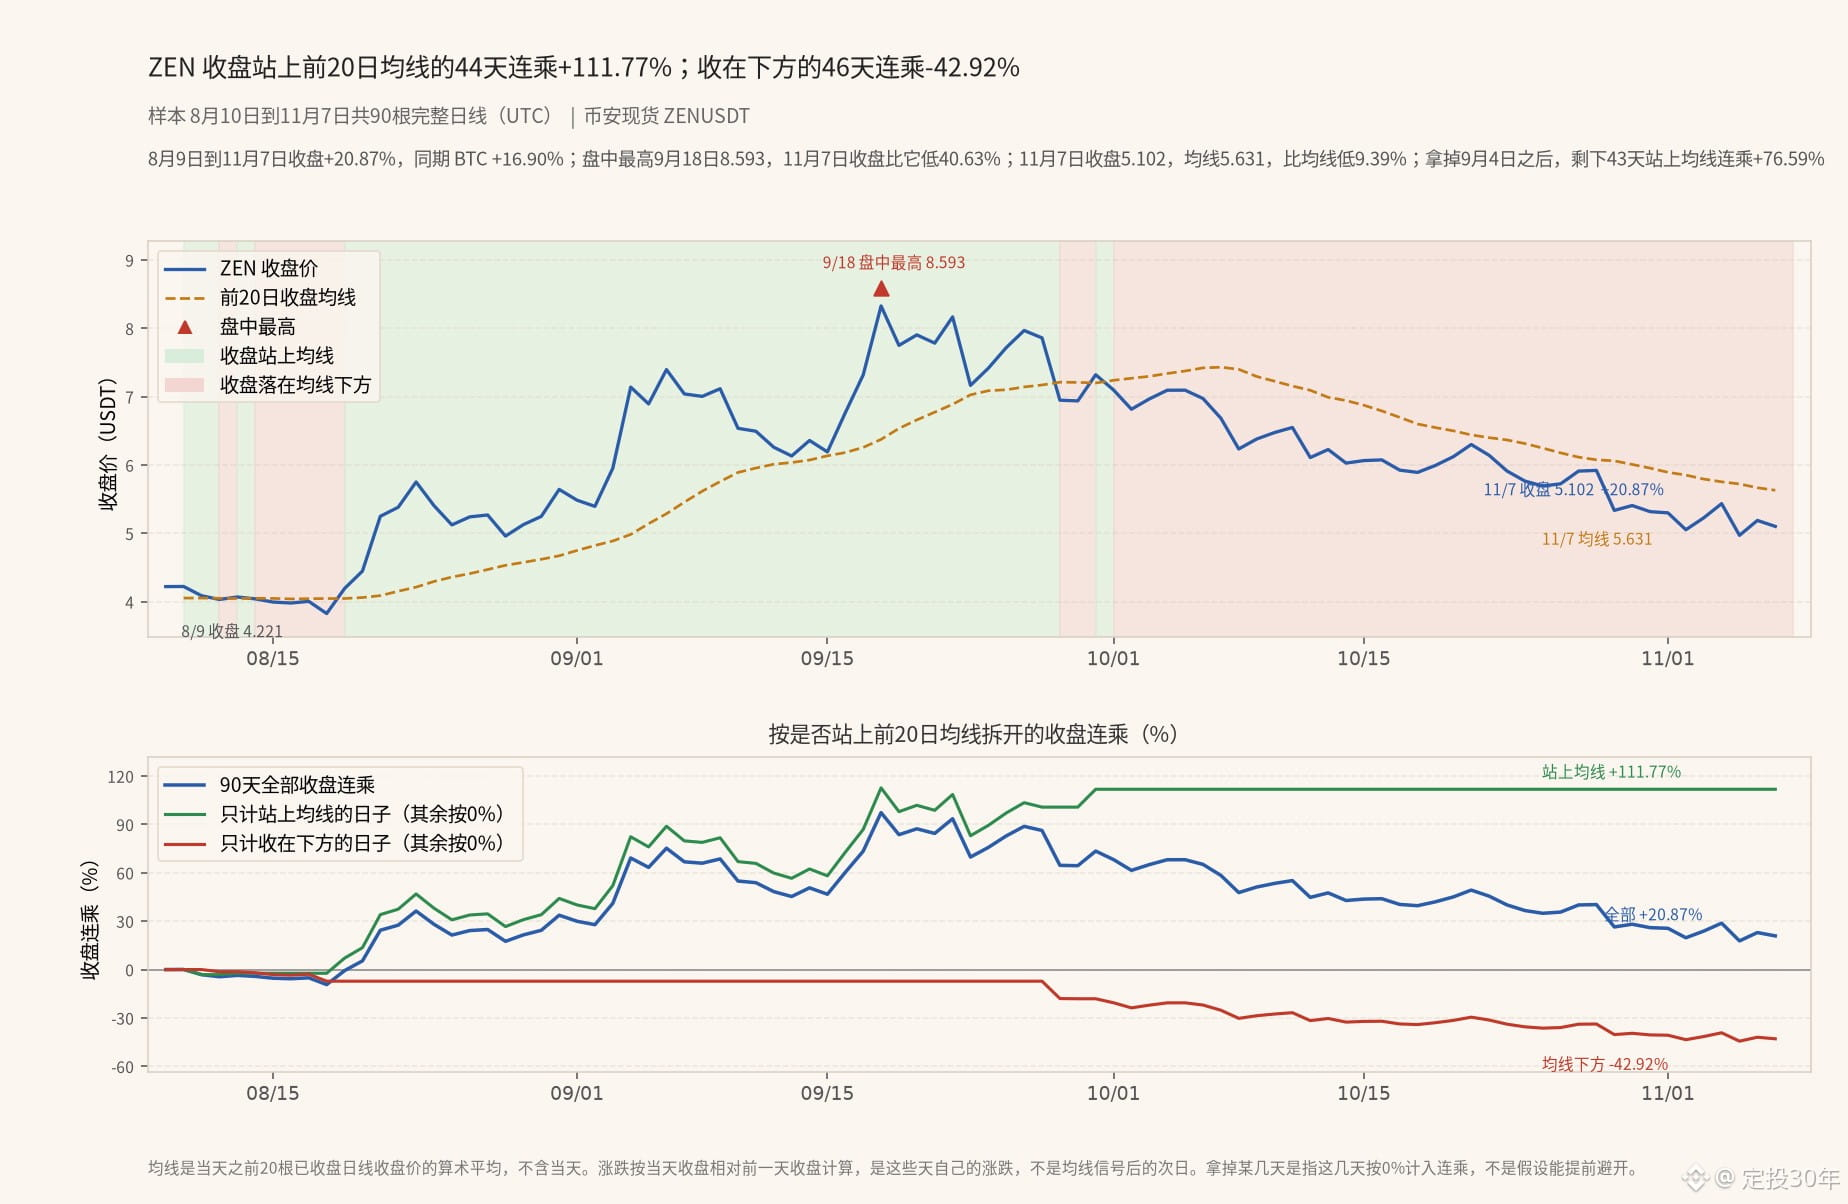
Looking at the Binance spot $ZEN chart over this recent stretch. The sample covers 90 complete daily candles from August 10 to November 7 (UTC). Before these 90 days began, the August 9 close was 4.221; on November 7, it closed at 5.102, up 20.87%. Over the same period, $BTC went from 64901.59 to 75867.59, up 16.90%. $ZEN climbed higher in between: its intraday high was 8.593 on September 18, and it closed that day at 8.327. The November 7 close was 40.63% below that high, and it would need to rise 68.42% to get back there. The intraday low was 3.79 on August 19.
I broke down these 90 days by where the closes sat relative to the moving average. For each day, I took the 20 completed daily candles before it, calculated an average from their closes, then checked whether that day's close was above or below the line. Gains and losses are based on that day's close relative to the previous day's close. They reflect the moves made during those days themselves, not the day after a moving-average signal. November 7 is the last complete daily candle in the sample; incomplete days after that aren't included.
Over the 90 days, 44 closes were above this moving average and 46 were below it, with 7 crosses from one side to the other. Of the 44 days above the line, 26 closed higher and 18 lower; the average return was +1.93%, the median was +1.79%, and the compounded return across these 44 days was +111.77%. Of the 46 days below the line, 20 closed higher and 26 lower; the average return was -1.15%, the median was -0.45%, and the compounded return across these 46 days was -42.92%.
The biggest gain while above the moving average was on September 4: the previous day closed at 5.954, and that day closed at 7.14, up 19.92%. The steepest drop was on September 23: the previous day closed at 8.167, and that day closed at 7.165, down 12.27%. After falling below the moving average, the biggest gain was on November 6: the previous day closed at 4.971, and that day closed at 5.189, up 4.39%; the steepest drop was on September 28: the previous day closed at 7.86, and that day closed at 6.948, down 11.60%.
The longest stretch above the moving average ran from August 19 through September 27, lasting 40 days. The longest stretch below it ran from October 1 through November 7, lasting 38 days. On November 7, it closed at 5.102, while the moving average that day was 5.631, putting the close 9.39% below the average. Even excluding September 4, of the remaining 43 days above the moving average, 25 closed higher and 18 lower; the average return was +1.51%, and the compounded return was +76.59%. If the returns on all 44 days above the moving average are treated as 0%, the compounded return for the other 46 days is -42.92%. Overall, the close was up 20.87% across these 90 days, with 46 days closing higher than the previous day and 44 closing lower.
This is an observation about these 90 days only. It shows that most of the gains during this period accumulated on days when the close was above the 20-day moving average; it doesn't mean that being above the moving average guarantees further gains. When you look at $ZEN , do you usually first check which side of this moving average the close is on, or are you more focused on how far it still is from that September 18 high?
I broke down these 90 days by where the closes sat relative to the moving average. For each day, I took the 20 completed daily candles before it, calculated an average from their closes, then checked whether that day's close was above or below the line. Gains and losses are based on that day's close relative to the previous day's close. They reflect the moves made during those days themselves, not the day after a moving-average signal. November 7 is the last complete daily candle in the sample; incomplete days after that aren't included.
Over the 90 days, 44 closes were above this moving average and 46 were below it, with 7 crosses from one side to the other. Of the 44 days above the line, 26 closed higher and 18 lower; the average return was +1.93%, the median was +1.79%, and the compounded return across these 44 days was +111.77%. Of the 46 days below the line, 20 closed higher and 26 lower; the average return was -1.15%, the median was -0.45%, and the compounded return across these 46 days was -42.92%.
The biggest gain while above the moving average was on September 4: the previous day closed at 5.954, and that day closed at 7.14, up 19.92%. The steepest drop was on September 23: the previous day closed at 8.167, and that day closed at 7.165, down 12.27%. After falling below the moving average, the biggest gain was on November 6: the previous day closed at 4.971, and that day closed at 5.189, up 4.39%; the steepest drop was on September 28: the previous day closed at 7.86, and that day closed at 6.948, down 11.60%.
The longest stretch above the moving average ran from August 19 through September 27, lasting 40 days. The longest stretch below it ran from October 1 through November 7, lasting 38 days. On November 7, it closed at 5.102, while the moving average that day was 5.631, putting the close 9.39% below the average. Even excluding September 4, of the remaining 43 days above the moving average, 25 closed higher and 18 lower; the average return was +1.51%, and the compounded return was +76.59%. If the returns on all 44 days above the moving average are treated as 0%, the compounded return for the other 46 days is -42.92%. Overall, the close was up 20.87% across these 90 days, with 46 days closing higher than the previous day and 44 closing lower.
This is an observation about these 90 days only. It shows that most of the gains during this period accumulated on days when the close was above the 20-day moving average; it doesn't mean that being above the moving average guarantees further gains. When you look at $ZEN , do you usually first check which side of this moving average the close is on, or are you more focused on how far it still is from that September 18 high?