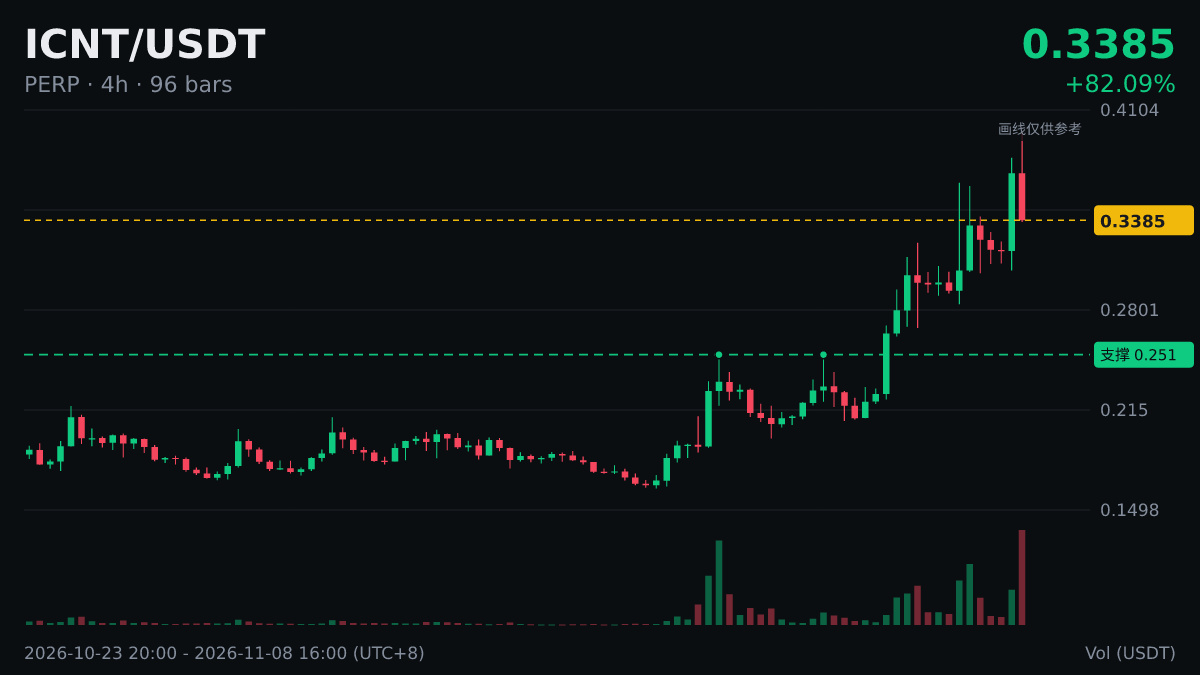
$ICNT |4-hour RSI (14) 77.6|Overbought
Before looking at the position, first understand RSI.
The 14 in RSI refers to 14 candlesticks: on a 4-hour chart, that covers a little over two days (56 hours); on a daily chart, it covers exactly two weeks.
RSI is calculated from historical prices and reflects the pace of past gains and losses. It can’t tell you what will happen next.
The same data can mean very different things in different market conditions, so don’t blindly apply rules of thumb.
#ICNT
Before looking at the position, first understand RSI.
The 14 in RSI refers to 14 candlesticks: on a 4-hour chart, that covers a little over two days (56 hours); on a daily chart, it covers exactly two weeks.
RSI is calculated from historical prices and reflects the pace of past gains and losses. It can’t tell you what will happen next.
The same data can mean very different things in different market conditions, so don’t blindly apply rules of thumb.
#ICNT