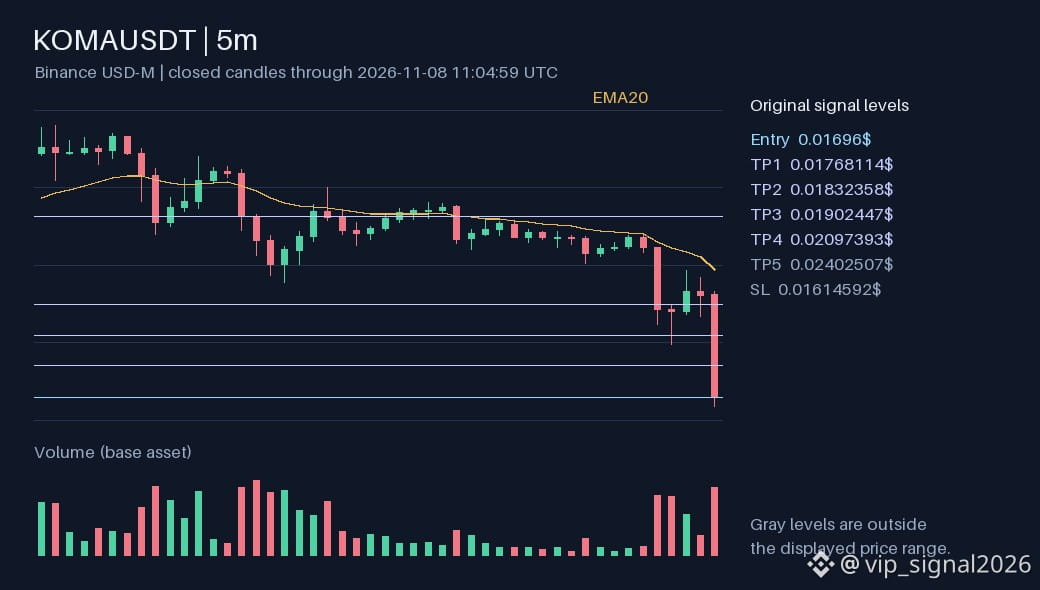
$KOMA LONG
Looking for a bottom using an indicator is a classic.
RSI on the 1-minute chart is in the oversold zone.
➡️Entry point: 0.01696$
🎯Take profit 1: 0.01768114$
🎯Take profit 2: 0.01832358$
🎯Take profit 3: 0.01902447$
🎯Take profit 4: 0.02097393$
🎯Take profit 5: 0.02402507$
🛡Stop: 0.01614592$
📈 RSI14: m1 20.4 • m5 20.0 • m15 30.3 • m30 37.6
📊 VOL: m1 $47.5K • m5 $81.7K • m15 $2.6M • m30 $2.7M
🧲 OI: now $9.2M • 5m -1.2% • 15m +0.8% • 30m -10.5%
A decline does not guarantee a bounce.
At the time of analysis, the price was beyond the stop level. The source's idea remains conditional.
⚠️ Trading involves risk. This material is not financial advice. You make the decision and are responsible for it. DYOR.
#KOMA #RiskManagement
Looking for a bottom using an indicator is a classic.
RSI on the 1-minute chart is in the oversold zone.
➡️Entry point: 0.01696$
🎯Take profit 1: 0.01768114$
🎯Take profit 2: 0.01832358$
🎯Take profit 3: 0.01902447$
🎯Take profit 4: 0.02097393$
🎯Take profit 5: 0.02402507$
🛡Stop: 0.01614592$
📈 RSI14: m1 20.4 • m5 20.0 • m15 30.3 • m30 37.6
📊 VOL: m1 $47.5K • m5 $81.7K • m15 $2.6M • m30 $2.7M
🧲 OI: now $9.2M • 5m -1.2% • 15m +0.8% • 30m -10.5%
A decline does not guarantee a bounce.
At the time of analysis, the price was beyond the stop level. The source's idea remains conditional.
⚠️ Trading involves risk. This material is not financial advice. You make the decision and are responsible for it. DYOR.
#KOMA #RiskManagement