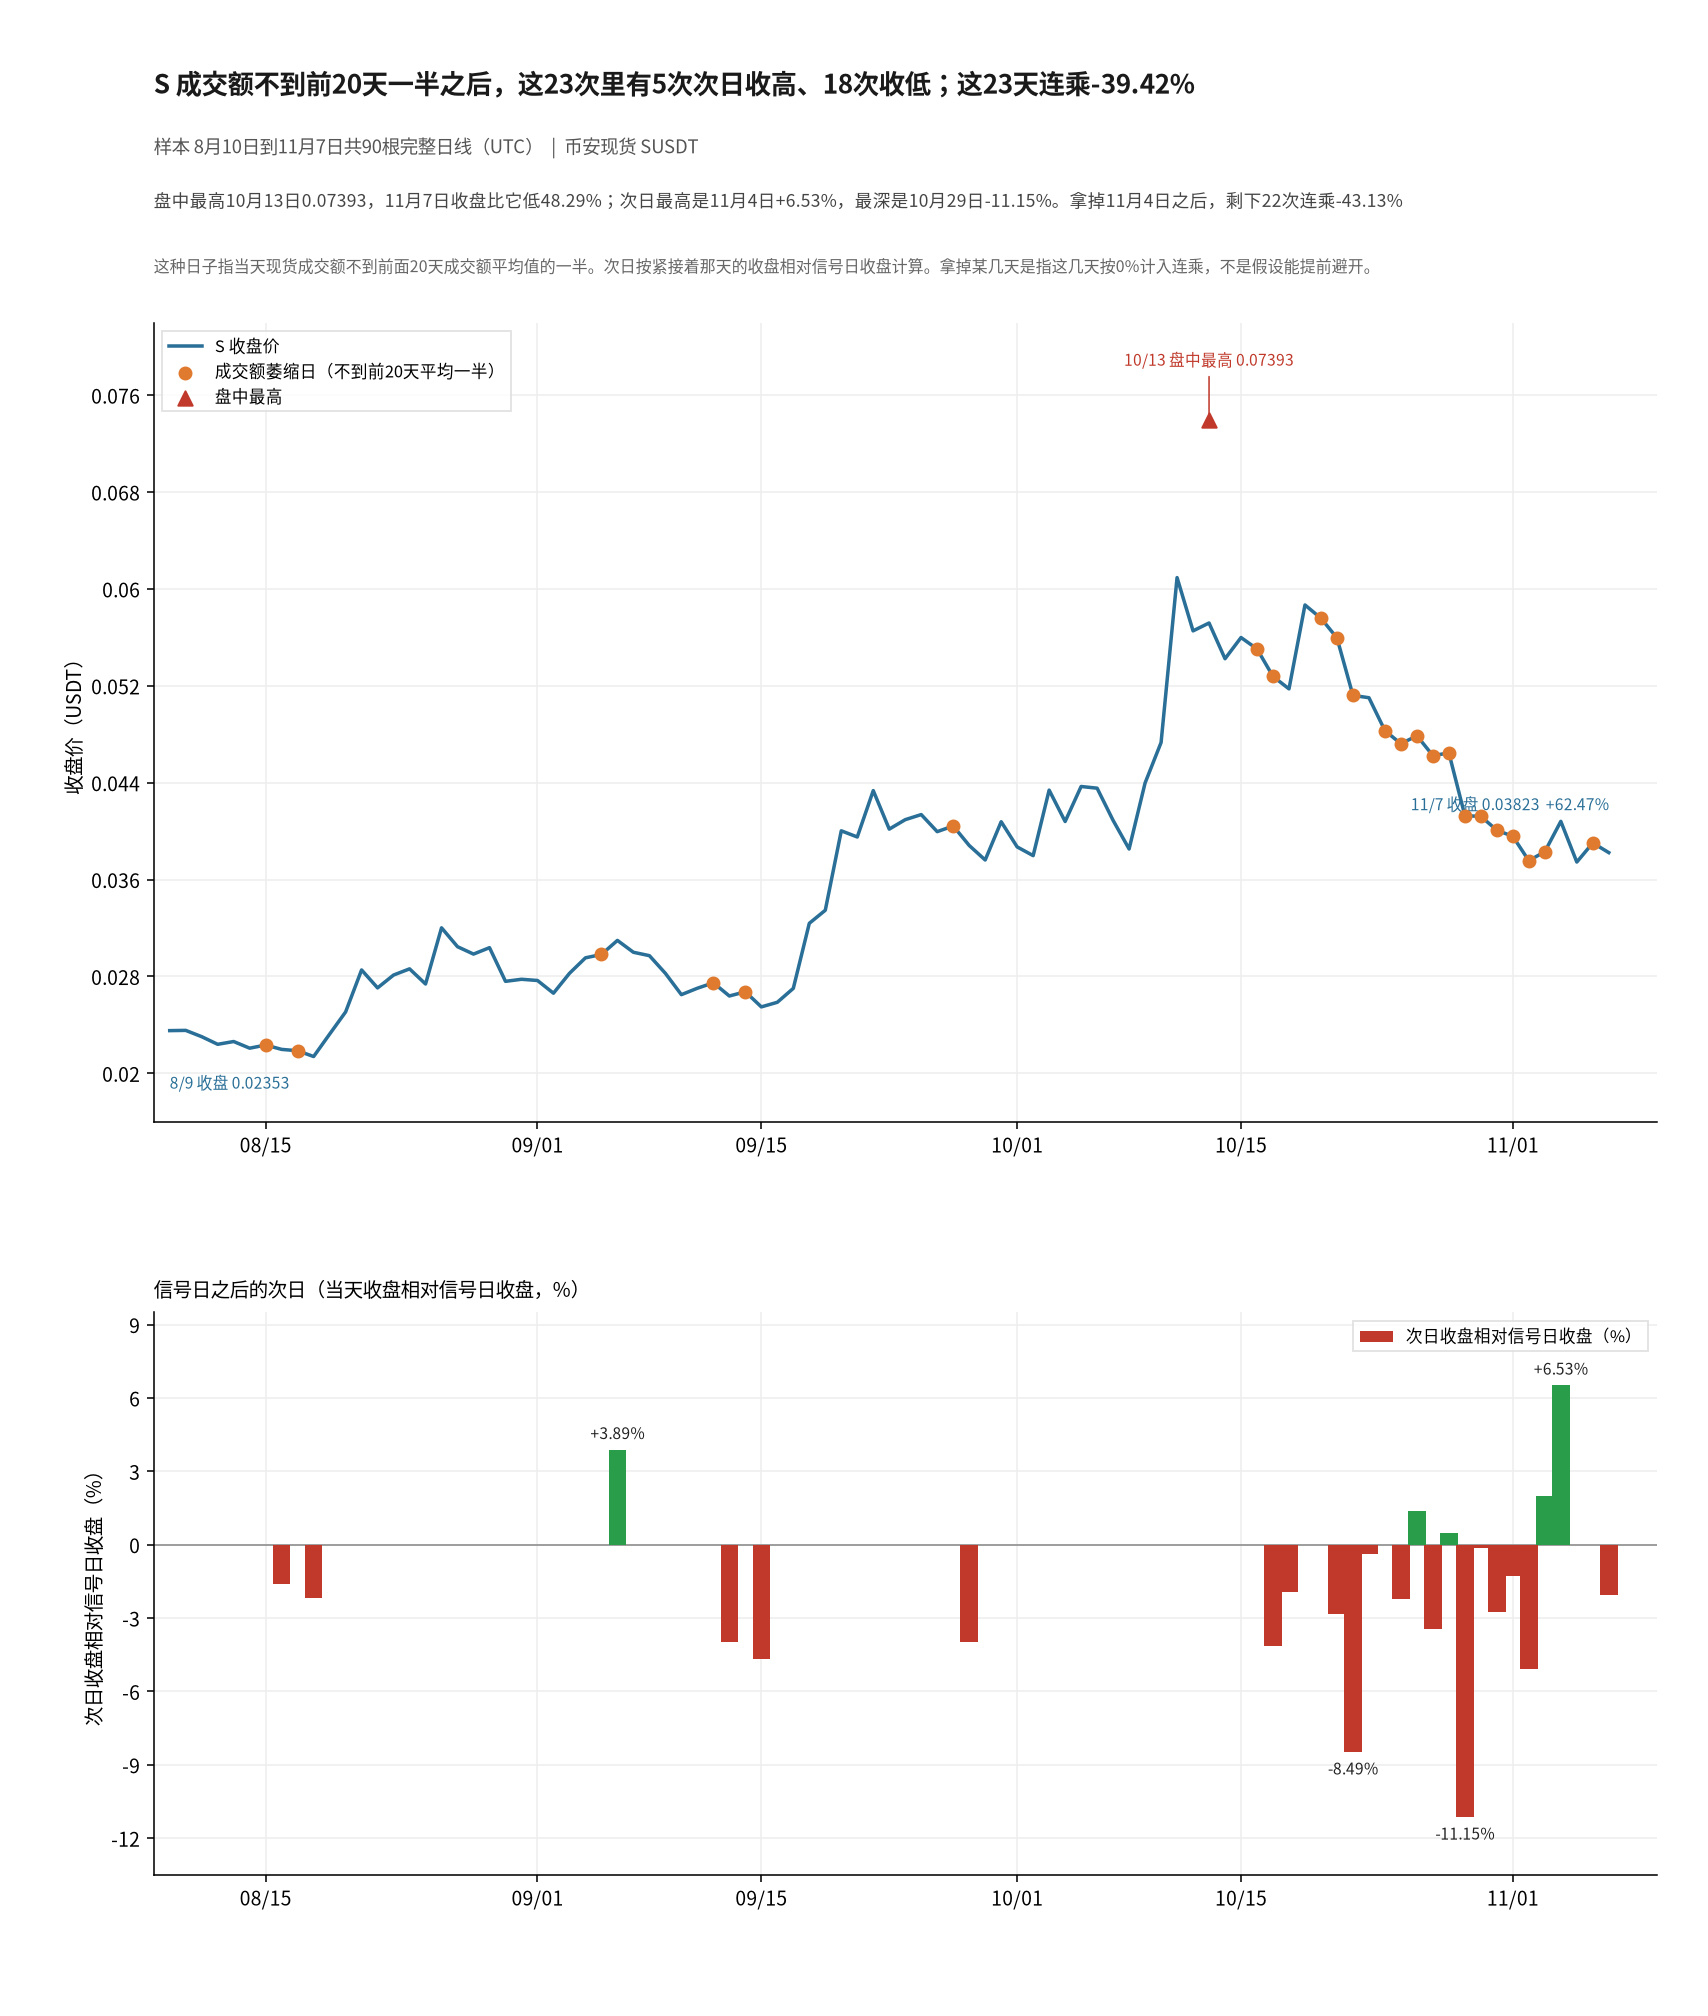
Looking at the recent chart for Binance spot $S . The sample covers 90 complete daily candles from August 10 to November 7 (UTC). Before these 90 days began, the August 9 close was 0.02353; on November 7, it closed at 0.03823, up 62.47%. Over the same period, $BTC went from 64901.59 to 75867.59, up 16.90%. $S surged higher in between: its intraday high was 0.07393 on October 13, closing that day at 0.05719. The November 7 close was 48.29% below that peak, and it would need to rise 93.38% to get back there. The intraday low was 0.02094 on August 18.
I count trading volume by comparing each day's spot trading volume with the average volume over the previous 20 days. If a day's volume is less than half that 20-day average, I count it as a noticeable drop in volume. For each occurrence, I look only at the close the following day and calculate its change relative to the candle's close. The previous 20 days used to calculate the average don't necessarily fall within this 90-day sample; and since the daily candle after November 7 is not complete yet, that day isn't counted as a signal. There are 89 trading days that can be paired this way, and the condition occurred 23 times. The most recent was November 6, which closed at 0.03903, with volume equal to 46.73% of the previous 20-day average; the next day, November 7, closed at 0.03823, down 2.05%.
Of these 23 instances, 5 closed higher the next day and 18 closed lower. The average return was -2.09%, the median was -2.19%, and the cumulative return across the 23 days was -39.42%. The biggest gain followed November 4: it closed at 0.03831 on the 3rd and at 0.04081 on the 4th, up 6.53%. The second biggest was September 6: it closed at 0.02982 on the 5th and at 0.03098 on the 6th, up 3.89%. The biggest drop followed October 29: it closed at 0.04646 on the 28th and at 0.04128 on the 29th, down 11.15%. The second biggest drop followed October 22: it closed at 0.05596 on the 21st and at 0.05121 on the 22nd, down 8.49%.
Even excluding November 4, the remaining 22 instances still had 4 higher closes and 18 lower ones, with an average return of -2.48% and a cumulative return of -43.13%. If the biggest drop, on October 29, is counted as 0%, the remaining 22 instances have an average return of -1.68% and a cumulative return of -31.82%. Seventeen of the 23 instances occurred after the October 13 intraday high; from October 24 through November 3, all 11 consecutive days met this low-volume condition. This is related to the surge in volume in mid-October: the highest-volume day in this 90-day period was October 11, and the second-highest was October 13. Volume on many later days was below the elevated 20-day average. Looking only at the 8 instances whose 20-day window did not include October 13, 2 closed higher and 6 lower, with a cumulative return of -8.31%. If the close-to-close returns on those 23 days are all set to 0%, the other 67 days have a cumulative return of +168.21%. Overall, the 90-day closing return was +62.47%; 41 days closed higher than the previous day and 49 closed lower.
These 23 instances are observations from a 90-day period, and the low-volume days in the second half were clustered after the peak. They shouldn't be taken to mean that the day after volume drops to half its average will necessarily be down. When you see volume suddenly fall well below the previous 20-day average, do you first check whether there was a recent high-volume peak, or do you treat it directly as a signal?
I count trading volume by comparing each day's spot trading volume with the average volume over the previous 20 days. If a day's volume is less than half that 20-day average, I count it as a noticeable drop in volume. For each occurrence, I look only at the close the following day and calculate its change relative to the candle's close. The previous 20 days used to calculate the average don't necessarily fall within this 90-day sample; and since the daily candle after November 7 is not complete yet, that day isn't counted as a signal. There are 89 trading days that can be paired this way, and the condition occurred 23 times. The most recent was November 6, which closed at 0.03903, with volume equal to 46.73% of the previous 20-day average; the next day, November 7, closed at 0.03823, down 2.05%.
Of these 23 instances, 5 closed higher the next day and 18 closed lower. The average return was -2.09%, the median was -2.19%, and the cumulative return across the 23 days was -39.42%. The biggest gain followed November 4: it closed at 0.03831 on the 3rd and at 0.04081 on the 4th, up 6.53%. The second biggest was September 6: it closed at 0.02982 on the 5th and at 0.03098 on the 6th, up 3.89%. The biggest drop followed October 29: it closed at 0.04646 on the 28th and at 0.04128 on the 29th, down 11.15%. The second biggest drop followed October 22: it closed at 0.05596 on the 21st and at 0.05121 on the 22nd, down 8.49%.
Even excluding November 4, the remaining 22 instances still had 4 higher closes and 18 lower ones, with an average return of -2.48% and a cumulative return of -43.13%. If the biggest drop, on October 29, is counted as 0%, the remaining 22 instances have an average return of -1.68% and a cumulative return of -31.82%. Seventeen of the 23 instances occurred after the October 13 intraday high; from October 24 through November 3, all 11 consecutive days met this low-volume condition. This is related to the surge in volume in mid-October: the highest-volume day in this 90-day period was October 11, and the second-highest was October 13. Volume on many later days was below the elevated 20-day average. Looking only at the 8 instances whose 20-day window did not include October 13, 2 closed higher and 6 lower, with a cumulative return of -8.31%. If the close-to-close returns on those 23 days are all set to 0%, the other 67 days have a cumulative return of +168.21%. Overall, the 90-day closing return was +62.47%; 41 days closed higher than the previous day and 49 closed lower.
These 23 instances are observations from a 90-day period, and the low-volume days in the second half were clustered after the peak. They shouldn't be taken to mean that the day after volume drops to half its average will necessarily be down. When you see volume suddenly fall well below the previous 20-day average, do you first check whether there was a recent high-volume peak, or do you treat it directly as a signal?