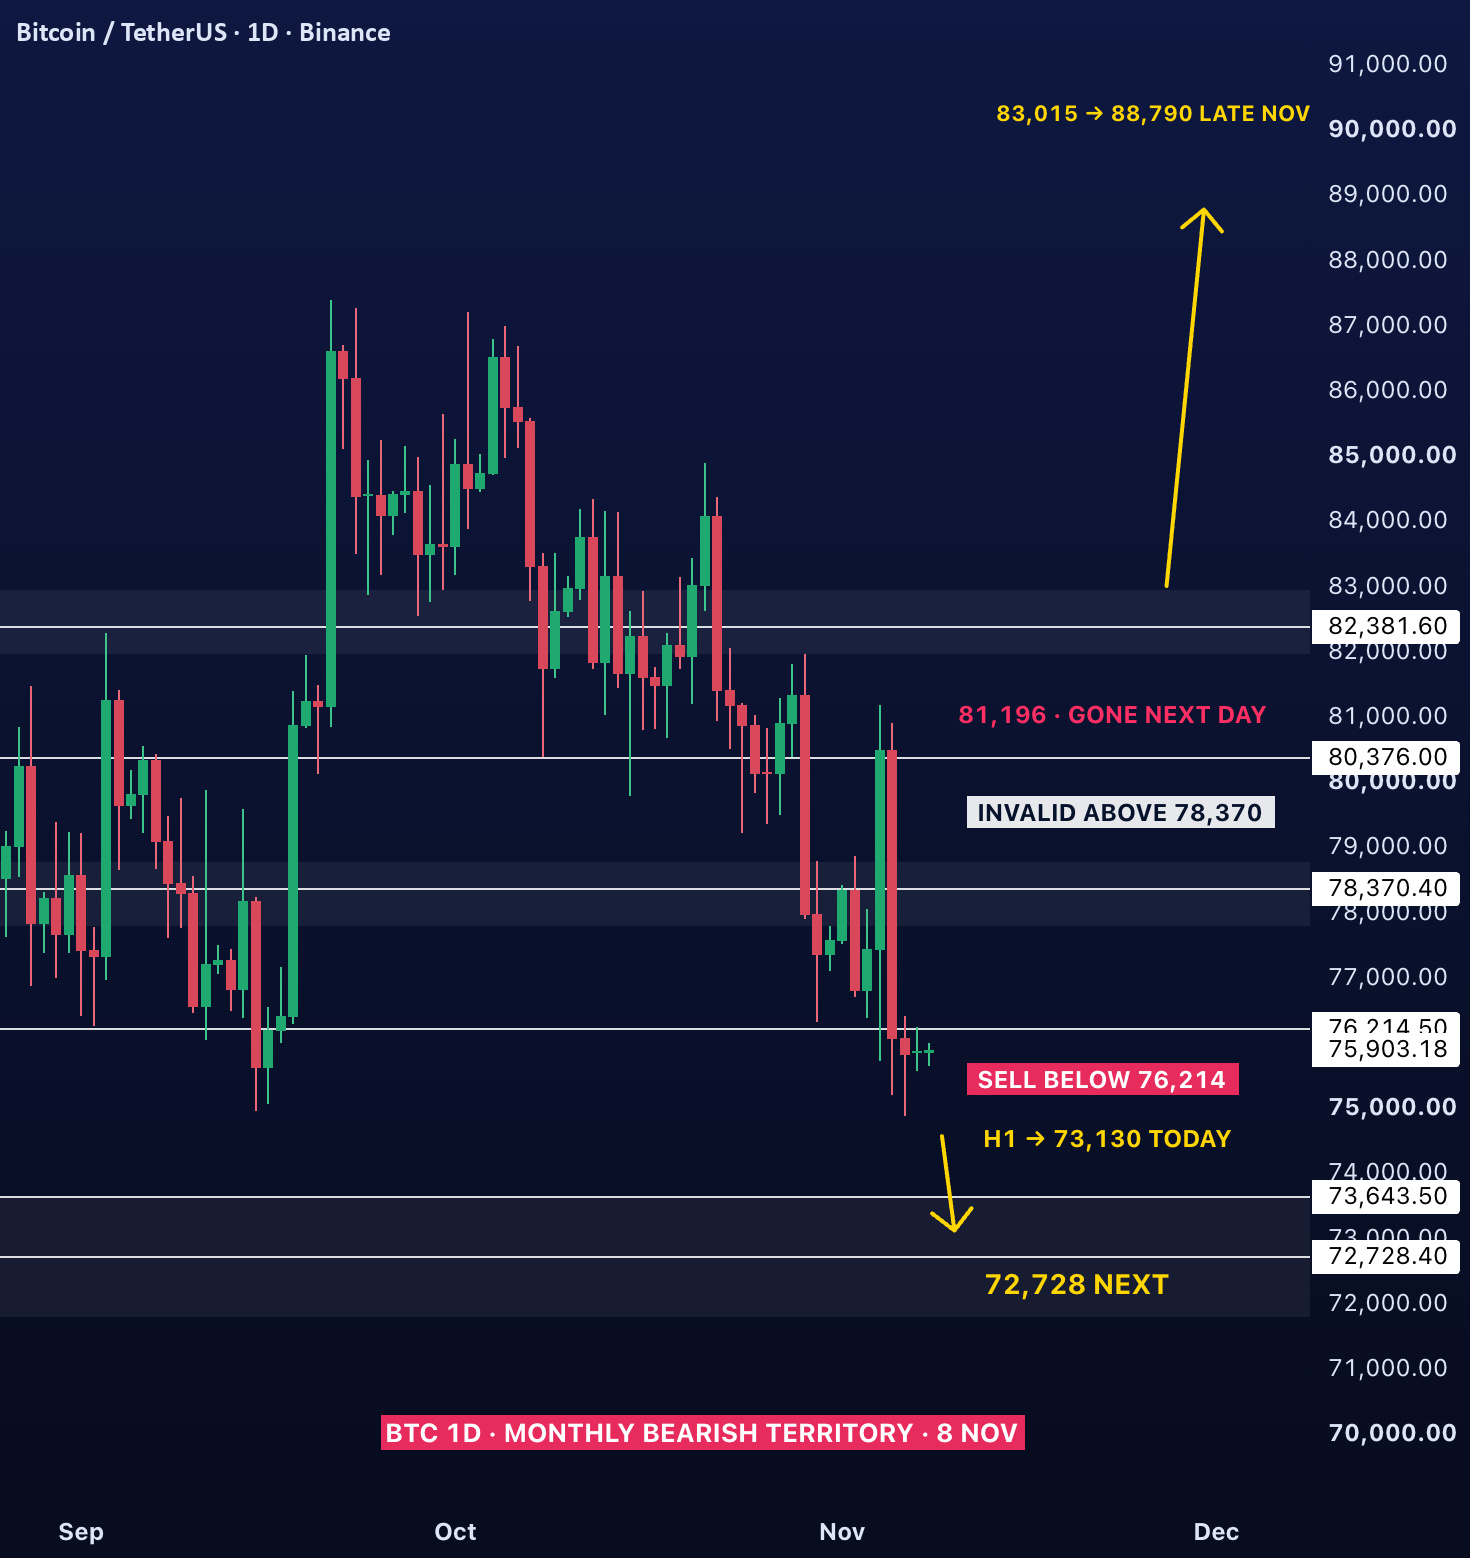


76,200 is the line that matters on the daily chart right now, and Bitcoin is under it.
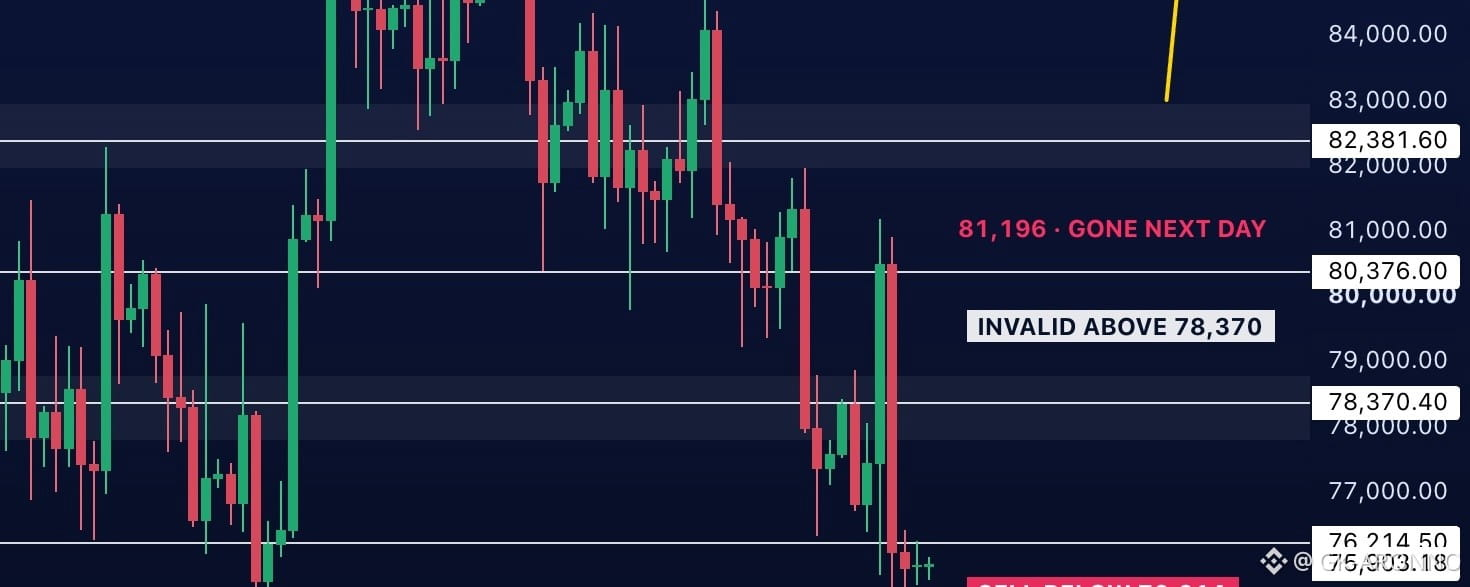
This week showed who is in charge. On Wednesday price ripped to 81,196, right through the monthly Pivot at 80,376, and by Thursday the whole move was gone. Friday dipped to 74,888 and the weekend has been dead flat around 75,900. That is monthly bearish territory, and down here price bleeds lower in slow, choppy steps, with bounces sold before they get going.
The bearish case
As long as Bitcoin stays under 76,200, the next stop is 72,700. The hourly projection lines up with it: below 74,580 the H1 arrow runs to 73,130 today, which is the first leg of that move into the 73,600 zone. A first touch of 72,700 is often bought, and a bounce back toward 74,600 is the more common next step.
Invalidation
A daily close back above 78,370 kills this. The daily projection only turns up in late November, and only above 83,015, so nothing on the chart argues for that yet.
Tuesday brings CPI, and that is the day this range is most likely to break.