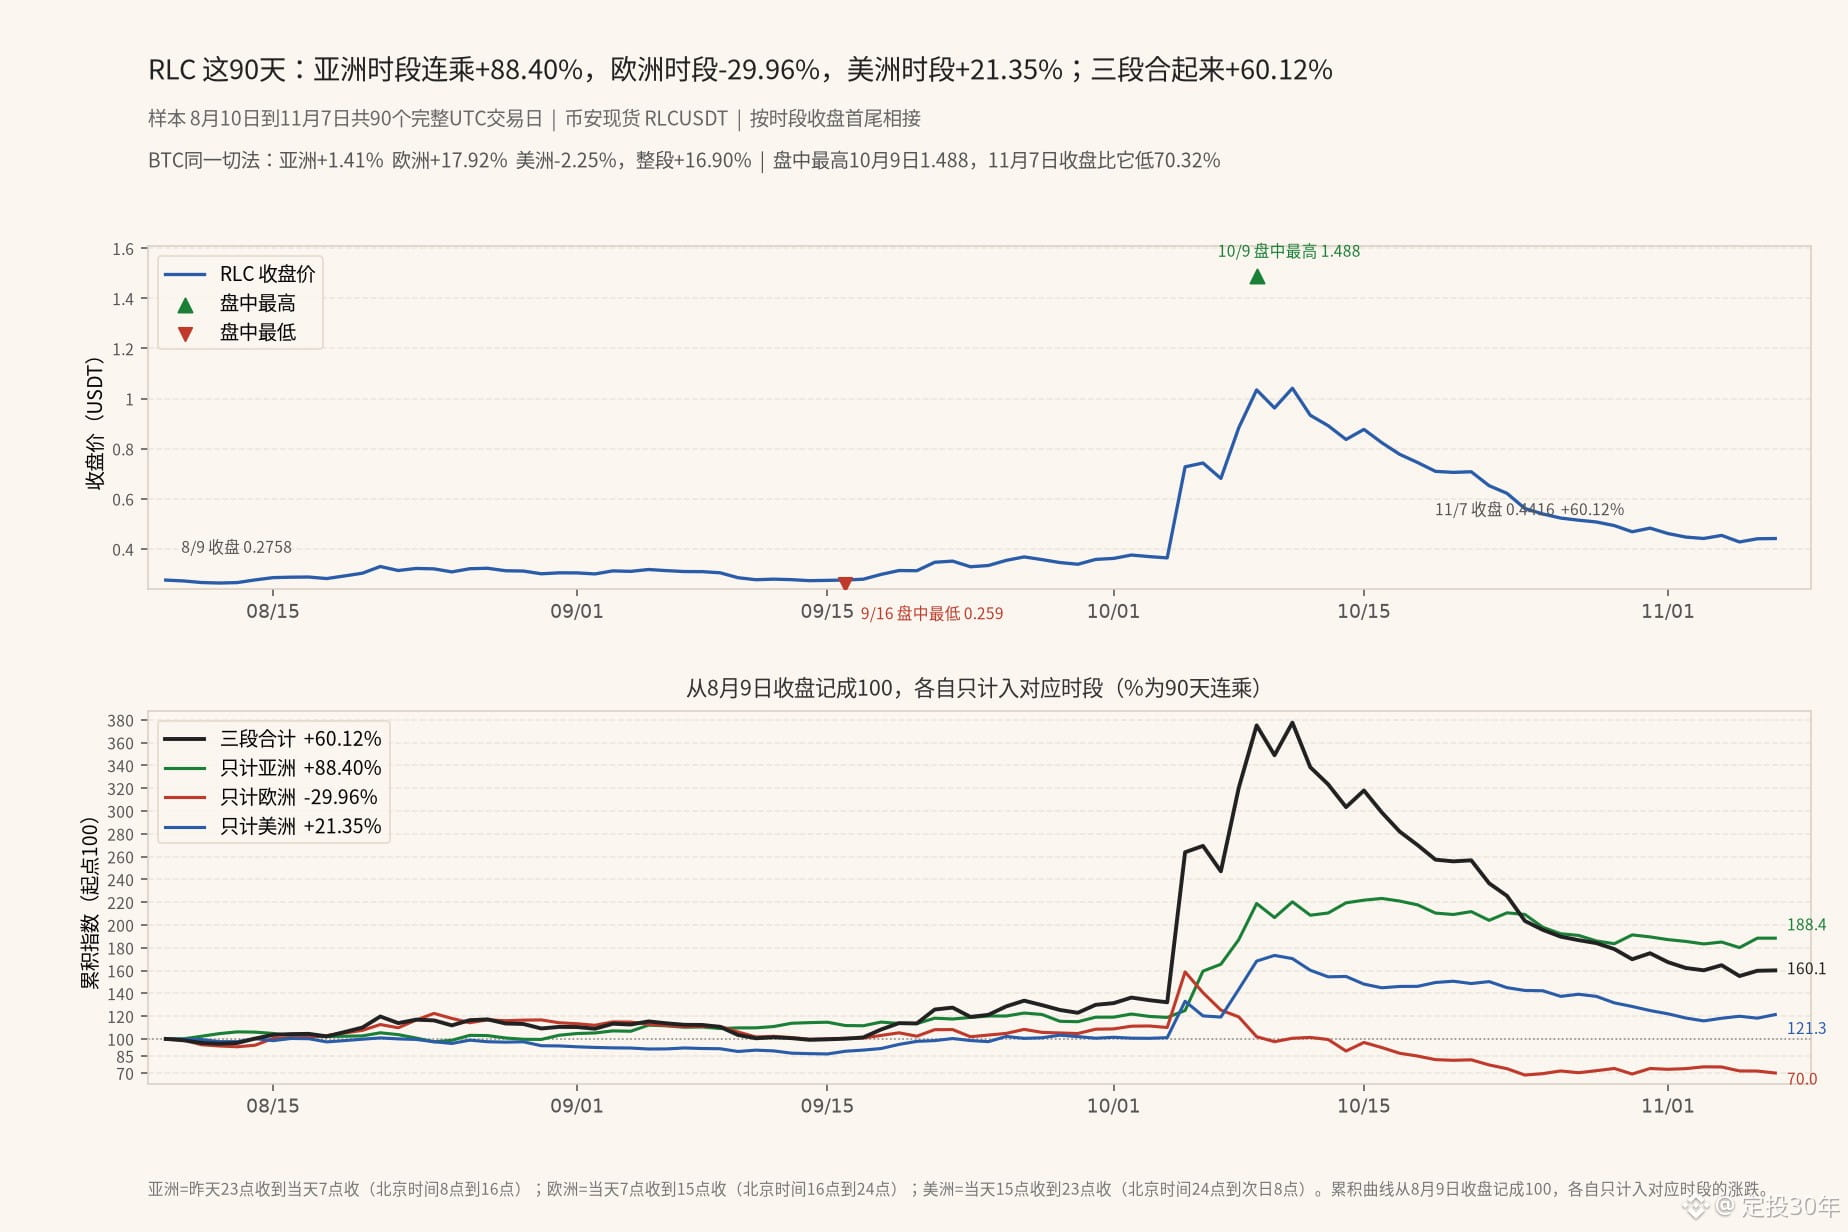
Breaking Binance spot $RLC ’s last 90 days into three time periods within each day and compounding them shows which time zone accounted for most of the gains and losses. The sample covers 90 complete UTC trading days, from August 10 to November 7. Before these 90 days began, the August 9 close was 0.2758; by November 7, it had closed at 0.4416, up 60.12%. Over the same period, $BTC went from 64901.59 to 75867.59, up 16.90%. $RLC climbed higher in between: its intraday high was 1.488 on October 9, when it closed at 1.0346. The November 7 close was 70.32% below that high; it would need to rise 236.96% to get back there. The intraday low was 0.259 on September 16.
The three periods are defined by joining the closes of UTC hourly candles. The Asia session runs from the close of the 23:00 candle the previous day to the close of the 07:00 candle that day, corresponding to 8 a.m. to 4 p.m. Beijing time. The Europe session then runs to the 15:00 close, corresponding to 4 p.m. to midnight Beijing time. The Americas session runs to the 23:00 close, corresponding to midnight to 8 a.m. the next day in Beijing time. Compounding the three periods gives exactly the day’s change from the previous day’s close. The unfinished daily candle for November 8 is not included.
Compounding just the 90 Asia sessions gives +88.40%; the Europe sessions give -29.96%; and the Americas sessions give +21.35%. Combined, the three periods give the overall gain of +60.12%. Applying the same breakdown to $BTC : the Asia session returned +1.41%, the Europe session +17.92%, and the Americas session -2.25%. Most of $BTC ’s gains over these 90 days came during the Europe session, while $RLC ’s gains came during the Asia session; the Europe session actually gave back some of those gains.
During the 90 days, 44 Asia sessions closed higher, 44 closed lower, and 2 were flat, yet compounding them gave +88.40%. The average return per session was +0.79%, while the median was 0.00%. In the Europe session, 42 closed higher and 48 lower; the average was -0.23% and the median -0.16%. In the Americas session, only 36 closed higher and 54 lower, yet compounding them still gave +21.35%. The average was +0.32%, while the median was -0.33%. By daily closes, 39 of these 90 days closed higher and 51 lower.
The biggest gain in the Asia session was on October 6: it went from 0.7276 to 0.929, up 27.68%; the full-day close was up 2.10%. The second-biggest was on October 9, when the Asia session gained 16.94%; the third-biggest was on October 8, at +13.05%. Compounded together, these three Asia sessions gained 68.79%; the remaining 87 Asia sessions compounded to +11.61%. The steepest drop in the Europe session was on October 9, at -14.60%; the full-day close that day was up 17.10%. The steepest drop in the Asia session was on October 10, at -5.64%.
If the Europe session had returned 0% every day over these 90 days, leaving only the Asia and Americas sessions, the compounded return would have been +128.61%. Even if the biggest Asia session, October 6, were counted as 0%, the remaining 89 Asia sessions would still have compounded to +47.55%, and all three sessions together would have returned +25.40%. If every Asia session were counted as 0%, leaving only the Europe and Americas sessions, the compounded return would have been -15.01%. In terms of trading volume, the Asia session accounted for 31.72% of spot trading volume over these 90 days, the Europe session 36.76%, and the Americas session 31.52%.
This is an observation based on dividing complete daily candles by time of day. A few days saw large jumps during the Asia session, so this shouldn’t be taken to mean that buying $RLC during the day in Beijing time will make it go up in the future. When you look at daily candles for coins like this, do you also break them down to see whether the gains and losses mostly happen during the daytime or overnight in Beijing time?
The three periods are defined by joining the closes of UTC hourly candles. The Asia session runs from the close of the 23:00 candle the previous day to the close of the 07:00 candle that day, corresponding to 8 a.m. to 4 p.m. Beijing time. The Europe session then runs to the 15:00 close, corresponding to 4 p.m. to midnight Beijing time. The Americas session runs to the 23:00 close, corresponding to midnight to 8 a.m. the next day in Beijing time. Compounding the three periods gives exactly the day’s change from the previous day’s close. The unfinished daily candle for November 8 is not included.
Compounding just the 90 Asia sessions gives +88.40%; the Europe sessions give -29.96%; and the Americas sessions give +21.35%. Combined, the three periods give the overall gain of +60.12%. Applying the same breakdown to $BTC : the Asia session returned +1.41%, the Europe session +17.92%, and the Americas session -2.25%. Most of $BTC ’s gains over these 90 days came during the Europe session, while $RLC ’s gains came during the Asia session; the Europe session actually gave back some of those gains.
During the 90 days, 44 Asia sessions closed higher, 44 closed lower, and 2 were flat, yet compounding them gave +88.40%. The average return per session was +0.79%, while the median was 0.00%. In the Europe session, 42 closed higher and 48 lower; the average was -0.23% and the median -0.16%. In the Americas session, only 36 closed higher and 54 lower, yet compounding them still gave +21.35%. The average was +0.32%, while the median was -0.33%. By daily closes, 39 of these 90 days closed higher and 51 lower.
The biggest gain in the Asia session was on October 6: it went from 0.7276 to 0.929, up 27.68%; the full-day close was up 2.10%. The second-biggest was on October 9, when the Asia session gained 16.94%; the third-biggest was on October 8, at +13.05%. Compounded together, these three Asia sessions gained 68.79%; the remaining 87 Asia sessions compounded to +11.61%. The steepest drop in the Europe session was on October 9, at -14.60%; the full-day close that day was up 17.10%. The steepest drop in the Asia session was on October 10, at -5.64%.
If the Europe session had returned 0% every day over these 90 days, leaving only the Asia and Americas sessions, the compounded return would have been +128.61%. Even if the biggest Asia session, October 6, were counted as 0%, the remaining 89 Asia sessions would still have compounded to +47.55%, and all three sessions together would have returned +25.40%. If every Asia session were counted as 0%, leaving only the Europe and Americas sessions, the compounded return would have been -15.01%. In terms of trading volume, the Asia session accounted for 31.72% of spot trading volume over these 90 days, the Europe session 36.76%, and the Americas session 31.52%.
This is an observation based on dividing complete daily candles by time of day. A few days saw large jumps during the Asia session, so this shouldn’t be taken to mean that buying $RLC during the day in Beijing time will make it go up in the future. When you look at daily candles for coins like this, do you also break them down to see whether the gains and losses mostly happen during the daytime or overnight in Beijing time?