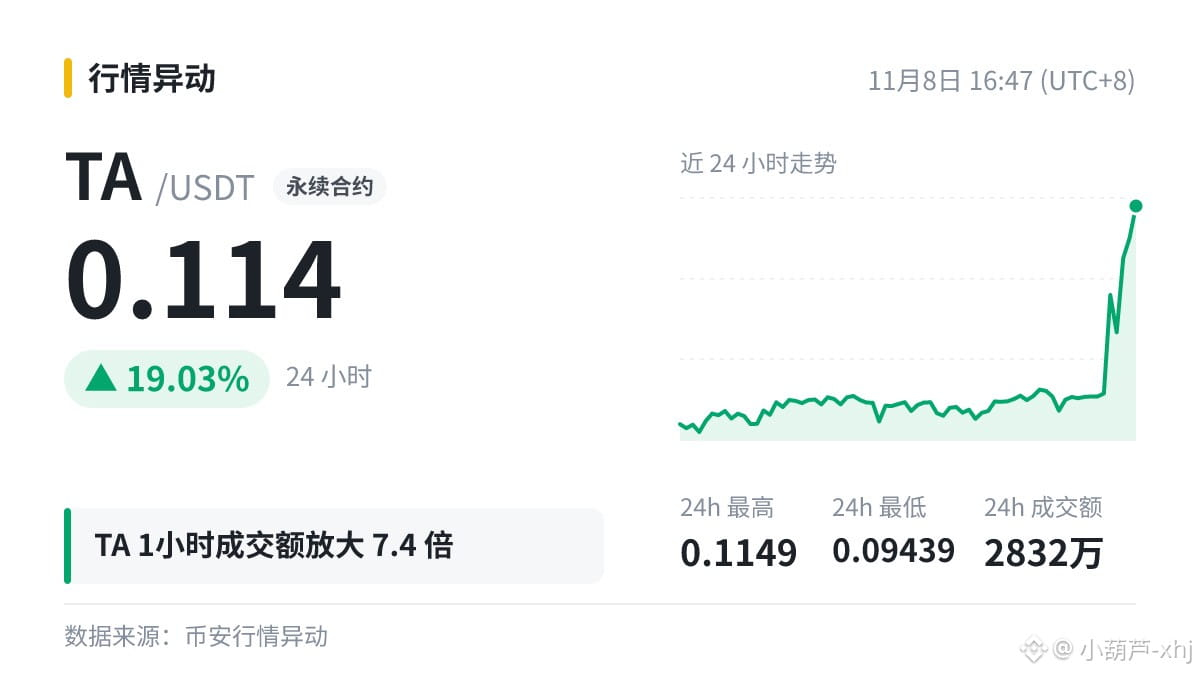
$TA 1The hourly trading volume was about $6.82 million, 7.4 times the previous average; the price rose 7.43% over the same period.
Let's break that number down.
To understand trading volume, read it alongside the candlestick chart: the price level where the coin settles and the length of its wicks often tell you more than volume alone.
When volume surges but the price barely moves, it means buyers and sellers are actively exchanging hands at that level. Which way the price moves next depends on which side gives way first.
Understanding this indicator helps you avoid being misled by a single number; it isn't a way to pinpoint tops and bottoms.
#TA
Let's break that number down.
To understand trading volume, read it alongside the candlestick chart: the price level where the coin settles and the length of its wicks often tell you more than volume alone.
When volume surges but the price barely moves, it means buyers and sellers are actively exchanging hands at that level. Which way the price moves next depends on which side gives way first.
Understanding this indicator helps you avoid being misled by a single number; it isn't a way to pinpoint tops and bottoms.
#TA