⚡ QUICK SETUP
* Pair: $BNB
B/USDT
* Side: LONG
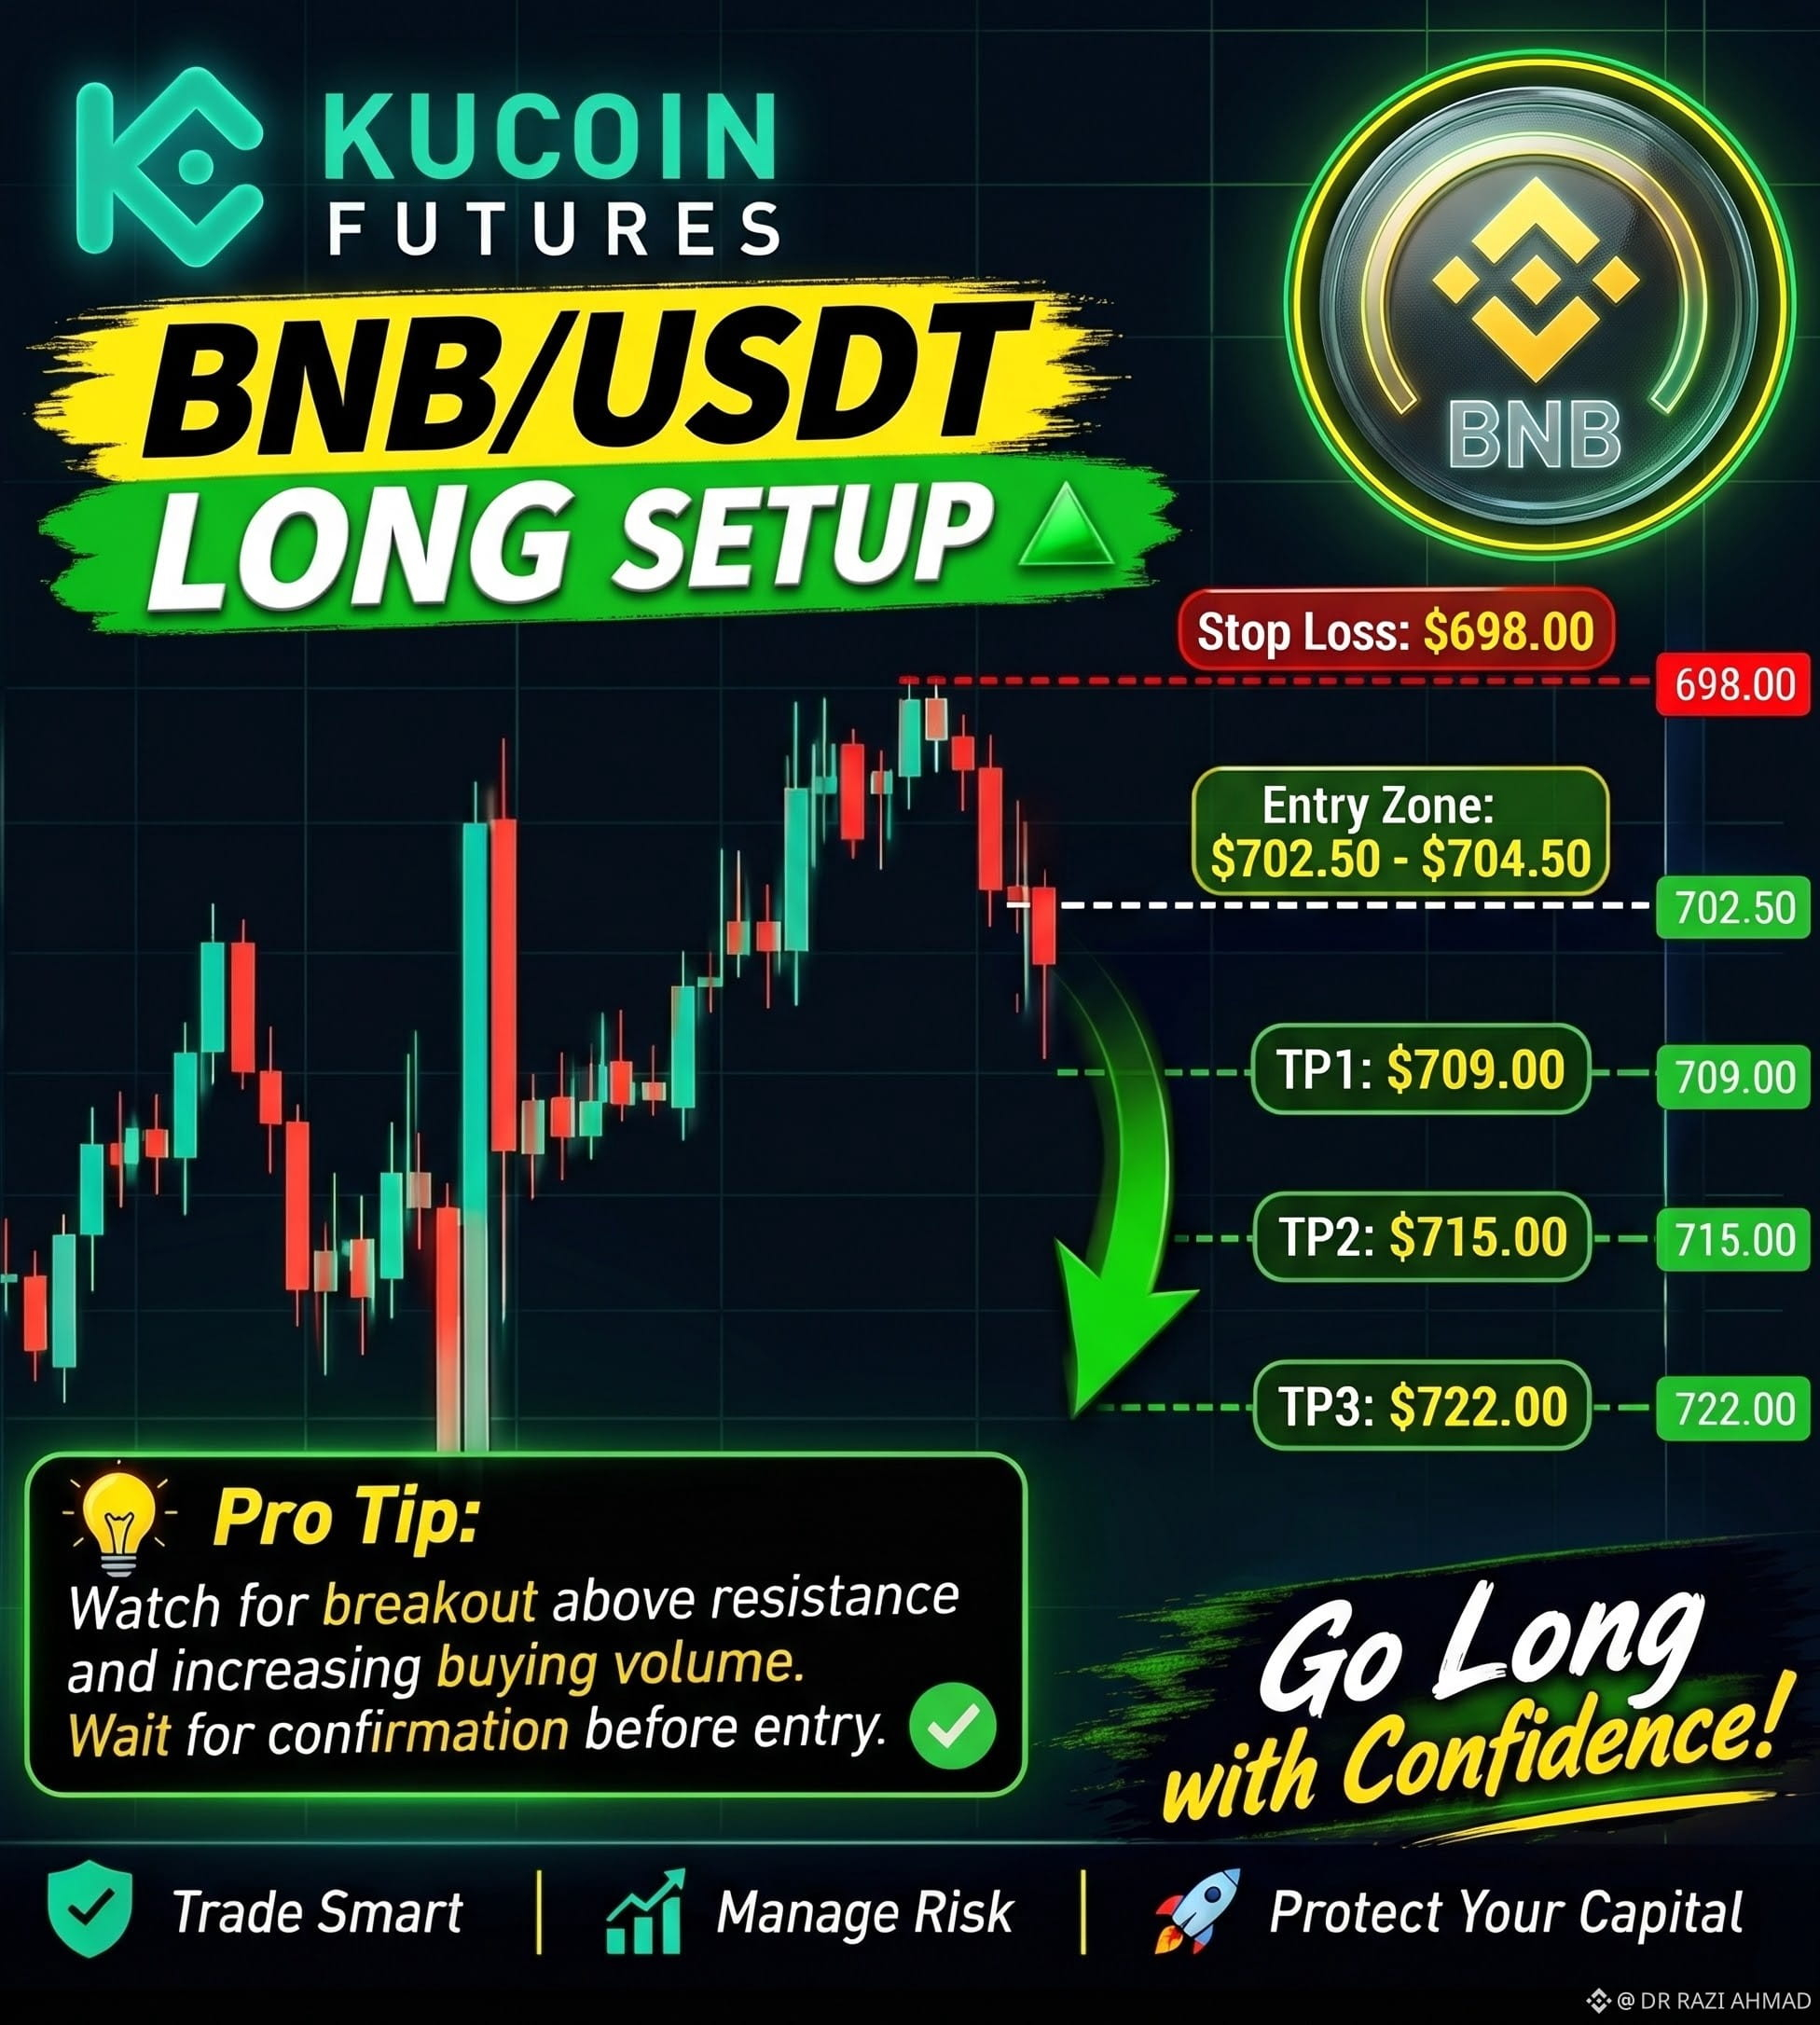
* Entry: $702.50 - $704.50 (riding the breakout momentum)
* SL: $698.00 (below structural support)
* Targets: $709.00 / $715.00 / $722.00
* Risk: Med-High
🔍 ANALYSIS
A quick short liquidation cluster at $702.24 has shattered immediate overhead resistance, forcing late shorters to cover their positions. We are seeing healthy buying volume on the 15-minute timeframe alongside a bullish EMAs breakout, suggesting that bulls are seizing control. Look for a small pullback toward the $702.50 area to catch this momentum before the squeeze drives price toward the next major liquidity pools.
Note: Visual chart of the setup is attached below.
BNB/USDT ka 15-minute timeframe setup chart yeh rha:
There is a file you can reference named "watermarked_img_13619565551390498305.jpg". Refer to this file by its name verbatim.
* Pair: $BNB
B/USDT
* Side: LONG
* Entry: $702.50 - $704.50 (riding the breakout momentum)
* SL: $698.00 (below structural support)
* Targets: $709.00 / $715.00 / $722.00
* Risk: Med-High
🔍 ANALYSIS
A quick short liquidation cluster at $702.24 has shattered immediate overhead resistance, forcing late shorters to cover their positions. We are seeing healthy buying volume on the 15-minute timeframe alongside a bullish EMAs breakout, suggesting that bulls are seizing control. Look for a small pullback toward the $702.50 area to catch this momentum before the squeeze drives price toward the next major liquidity pools.
Note: Visual chart of the setup is attached below.
BNB/USDT ka 15-minute timeframe setup chart yeh rha:
There is a file you can reference named "watermarked_img_13619565551390498305.jpg". Refer to this file by its name verbatim.