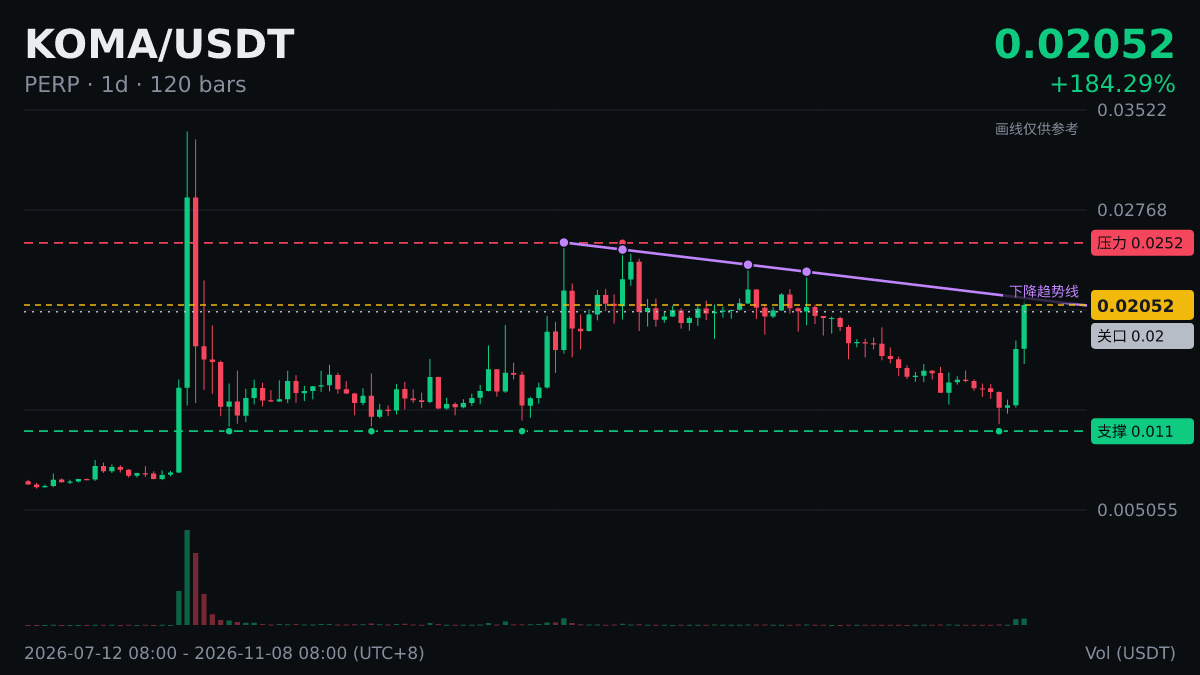
$KOMA The daily chart is above MA50 (0.01823), up 54.93% in 24h.
Let's talk about what lies behind this number.
To confirm whether the price has moved above or below it, many people go by the daily closing price. It's common for the price to cross it intraday and then move back.
A moving average is just a statistically calculated line; it has no special power in itself. Often, it's watched simply because everyone is watching it.
With leveraged trading, first work out whether you can withstand the worst-case scenario, then consider what the indicators are saying.
#KOMA
Let's talk about what lies behind this number.
To confirm whether the price has moved above or below it, many people go by the daily closing price. It's common for the price to cross it intraday and then move back.
A moving average is just a statistically calculated line; it has no special power in itself. Often, it's watched simply because everyone is watching it.
With leveraged trading, first work out whether you can withstand the worst-case scenario, then consider what the indicators are saying.
#KOMA