Money is flowing out, but prices aren’t falling—this week’s ETF data is interesting.
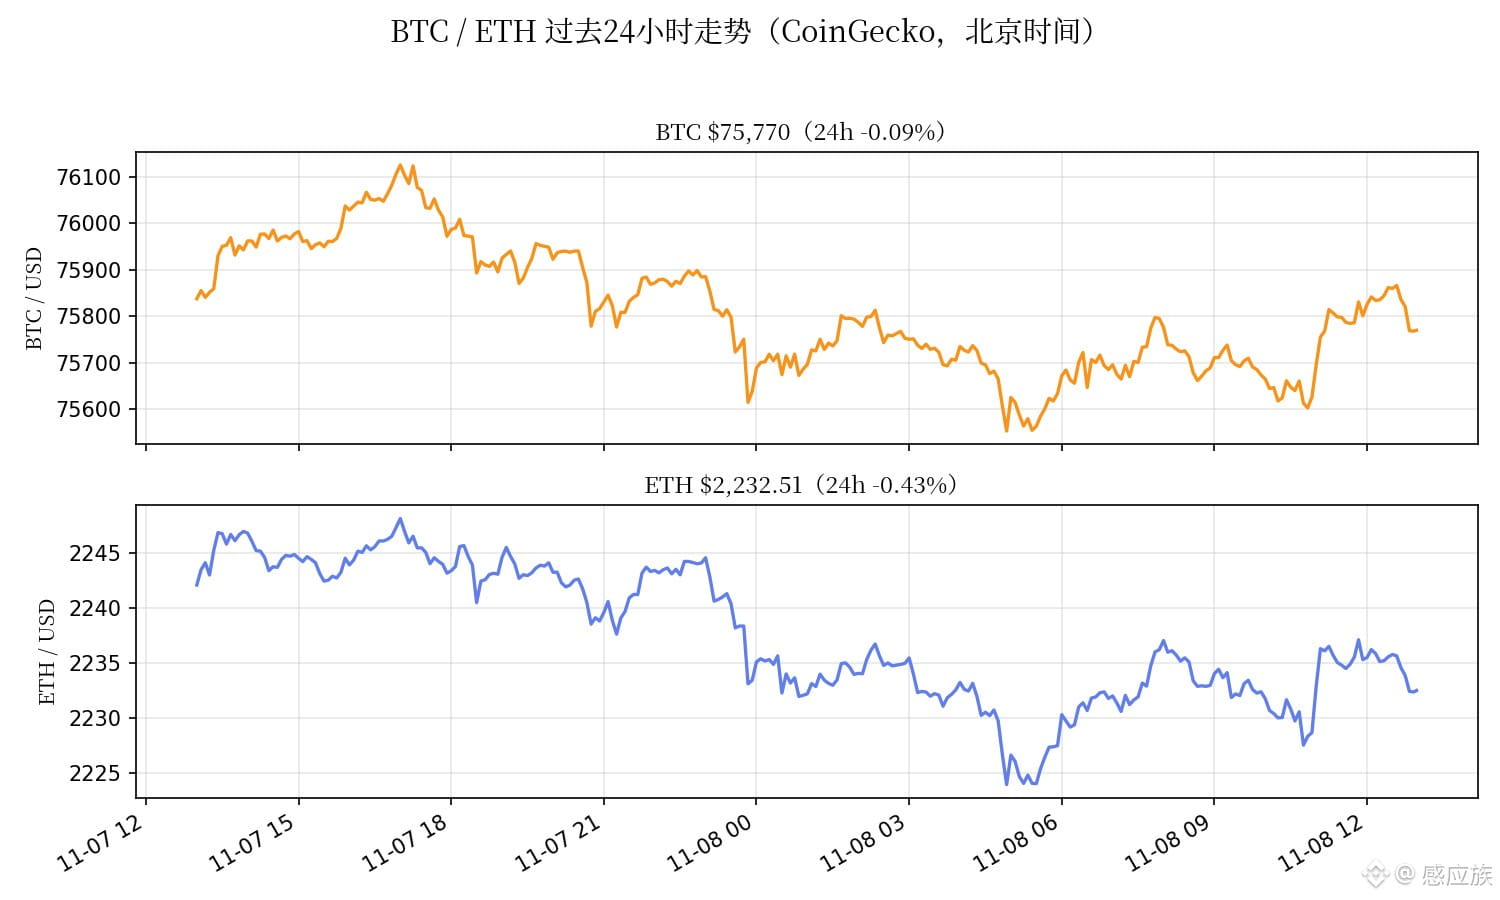
At 13:00, $BTC was around $75,767, down 0.1% over 24 hours; $ETH was around $2,232, down 0.4% (actual figures from CoinGecko). The price has been grinding around $75,500 for nearly two days without breaking down or bouncing, and is now sitting just above the 50-week moving average at $75,733.
But the flows look pretty grim: U.S. spot BTC ETFs saw total net outflows of about $1.28 billion last week (November 2–6), according to The Block, citing SoSoValue data. Net flows have turned negative year to date in 2026, at around -$910 million. Friday alone saw $412 million flow out, with BlackRock’s IBIT accounting for 88%. ETH ETFs fared even worse: -$365 million last week, marking their sixth consecutive week of net outflows. If this trend continues, 2026 could become the first full year of net outflows since spot ETFs launched.
Money is flowing out, but prices aren’t falling—there are two ways to read this: either selling pressure is drying up and sellers can no longer push prices lower, or weekend trading volumes are so thin that the real test hasn’t come yet. I lean toward the latter: ETF outflows are lagging data from after settlement. Monday’s U.S. market open and Tuesday’s CPI release (November 10) will be the real test. It’s too early to declare a bottom now.
Short position update #7: Opened shorts at 75,800–76,100 on November 7 at 13:00, with a median entry of 75,950. The current price is 75,767, down 0.24%; based on 100x margin, the unrealized profit is about +24%—down from +42% at 11:00, as the price has rebounded from 75,632. That’s the honest picture. Neither the 77,500 stop-loss nor the 4-hour close above 76,250 that would invalidate the trade has been triggered, so I’m holding.
The plan hasn’t changed: keep holding the short, with targets at 73,200 (take half off when reached) and 68,000. If the 4-hour candle closes below 75,500, I’ll consider adding to the short around 75,300–75,500. I’ll only consider flipping long if price reclaims 78,000 and holds above it. ETH is bearish in tandem; a break below 2,200 would accelerate the downtrend. Keep only a very small portion of total funds in 100x margin.
Do you think selling pressure is drying up, or is this the calm before the storm? Let’s discuss in the comments. (Prices: actual CoinGecko figures at 13:00 Beijing time on November 8; chart shows the past 24 hours.)
At 13:00, $BTC was around $75,767, down 0.1% over 24 hours; $ETH was around $2,232, down 0.4% (actual figures from CoinGecko). The price has been grinding around $75,500 for nearly two days without breaking down or bouncing, and is now sitting just above the 50-week moving average at $75,733.
But the flows look pretty grim: U.S. spot BTC ETFs saw total net outflows of about $1.28 billion last week (November 2–6), according to The Block, citing SoSoValue data. Net flows have turned negative year to date in 2026, at around -$910 million. Friday alone saw $412 million flow out, with BlackRock’s IBIT accounting for 88%. ETH ETFs fared even worse: -$365 million last week, marking their sixth consecutive week of net outflows. If this trend continues, 2026 could become the first full year of net outflows since spot ETFs launched.
Money is flowing out, but prices aren’t falling—there are two ways to read this: either selling pressure is drying up and sellers can no longer push prices lower, or weekend trading volumes are so thin that the real test hasn’t come yet. I lean toward the latter: ETF outflows are lagging data from after settlement. Monday’s U.S. market open and Tuesday’s CPI release (November 10) will be the real test. It’s too early to declare a bottom now.
Short position update #7: Opened shorts at 75,800–76,100 on November 7 at 13:00, with a median entry of 75,950. The current price is 75,767, down 0.24%; based on 100x margin, the unrealized profit is about +24%—down from +42% at 11:00, as the price has rebounded from 75,632. That’s the honest picture. Neither the 77,500 stop-loss nor the 4-hour close above 76,250 that would invalidate the trade has been triggered, so I’m holding.
The plan hasn’t changed: keep holding the short, with targets at 73,200 (take half off when reached) and 68,000. If the 4-hour candle closes below 75,500, I’ll consider adding to the short around 75,300–75,500. I’ll only consider flipping long if price reclaims 78,000 and holds above it. ETH is bearish in tandem; a break below 2,200 would accelerate the downtrend. Keep only a very small portion of total funds in 100x margin.
Do you think selling pressure is drying up, or is this the calm before the storm? Let’s discuss in the comments. (Prices: actual CoinGecko figures at 13:00 Beijing time on November 8; chart shows the past 24 hours.)