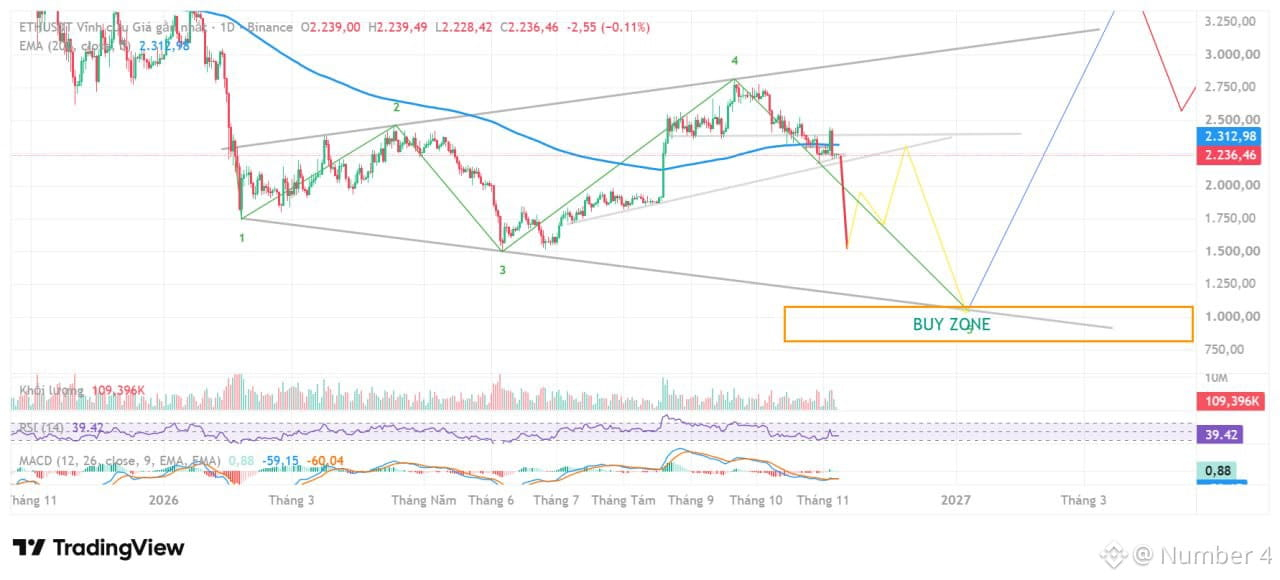
$ETH The ultimate pain was foreshadowed by the standard, distinctly wild pattern of the Wolfe Wave? Let’s look at the 1D chart:
1. The widening collision between the upper and lower boundaries, with progressively higher peaks and lower troughs over time, has formed a beautiful Wolf pattern according to the technical analysis school of thought.
2. Supporting technical indicators (EMA 200 & RSI): On the 1D timeframe, the EMA 200 is currently sloping downward and sits above price (around $2,312), while the RSI is hovering below 40. If the scenario of wave 5 reaching the $1,000 area plays out, this would be a widespread liquidity sweep to clear out heavily leveraged long positions before triggering a sharp reversal (the green line shooting back up to $3,250+).
In short: The market is hinting at a distinctly Wolfe Wave-style pattern. The 1-2-3-4-5 structural logic is entirely consistent with the geometric approach to price action, but the risks lie in the rather prolonged timeline (until early 2027) and the steep drop from around $2,230 to $1,000—a huge gap of roughly 50%. This calls for extremely disciplined capital management if you’re holding out for this scenario. Be greedy if the scenario unfolds as expected, and be bold about buying the bottom at point 5 when it appears (it won’t stay there long enough for you to hesitate or have second thoughts). The pattern is completely invalidated if price rises above 2k8. Personally, I think breaking above that level is very unlikely in these market conditions, and people generally don’t like doing difficult things, so the easiest path is still down. Let’s wait and see what happens! If you found this useful, please like, share, comment with your thoughts, and follow me if you’d like to get my latest technical analyses. Trade safely!
1. The widening collision between the upper and lower boundaries, with progressively higher peaks and lower troughs over time, has formed a beautiful Wolf pattern according to the technical analysis school of thought.
2. Supporting technical indicators (EMA 200 & RSI): On the 1D timeframe, the EMA 200 is currently sloping downward and sits above price (around $2,312), while the RSI is hovering below 40. If the scenario of wave 5 reaching the $1,000 area plays out, this would be a widespread liquidity sweep to clear out heavily leveraged long positions before triggering a sharp reversal (the green line shooting back up to $3,250+).
In short: The market is hinting at a distinctly Wolfe Wave-style pattern. The 1-2-3-4-5 structural logic is entirely consistent with the geometric approach to price action, but the risks lie in the rather prolonged timeline (until early 2027) and the steep drop from around $2,230 to $1,000—a huge gap of roughly 50%. This calls for extremely disciplined capital management if you’re holding out for this scenario. Be greedy if the scenario unfolds as expected, and be bold about buying the bottom at point 5 when it appears (it won’t stay there long enough for you to hesitate or have second thoughts). The pattern is completely invalidated if price rises above 2k8. Personally, I think breaking above that level is very unlikely in these market conditions, and people generally don’t like doing difficult things, so the easiest path is still down. Let’s wait and see what happens! If you found this useful, please like, share, comment with your thoughts, and follow me if you’d like to get my latest technical analyses. Trade safely!