BROCCOLI714: Short-term trading volume has continued to expand as the price moves up. First distinguish a breakout from a pullback; don't treat an intraday high as confirmation that the price has held.
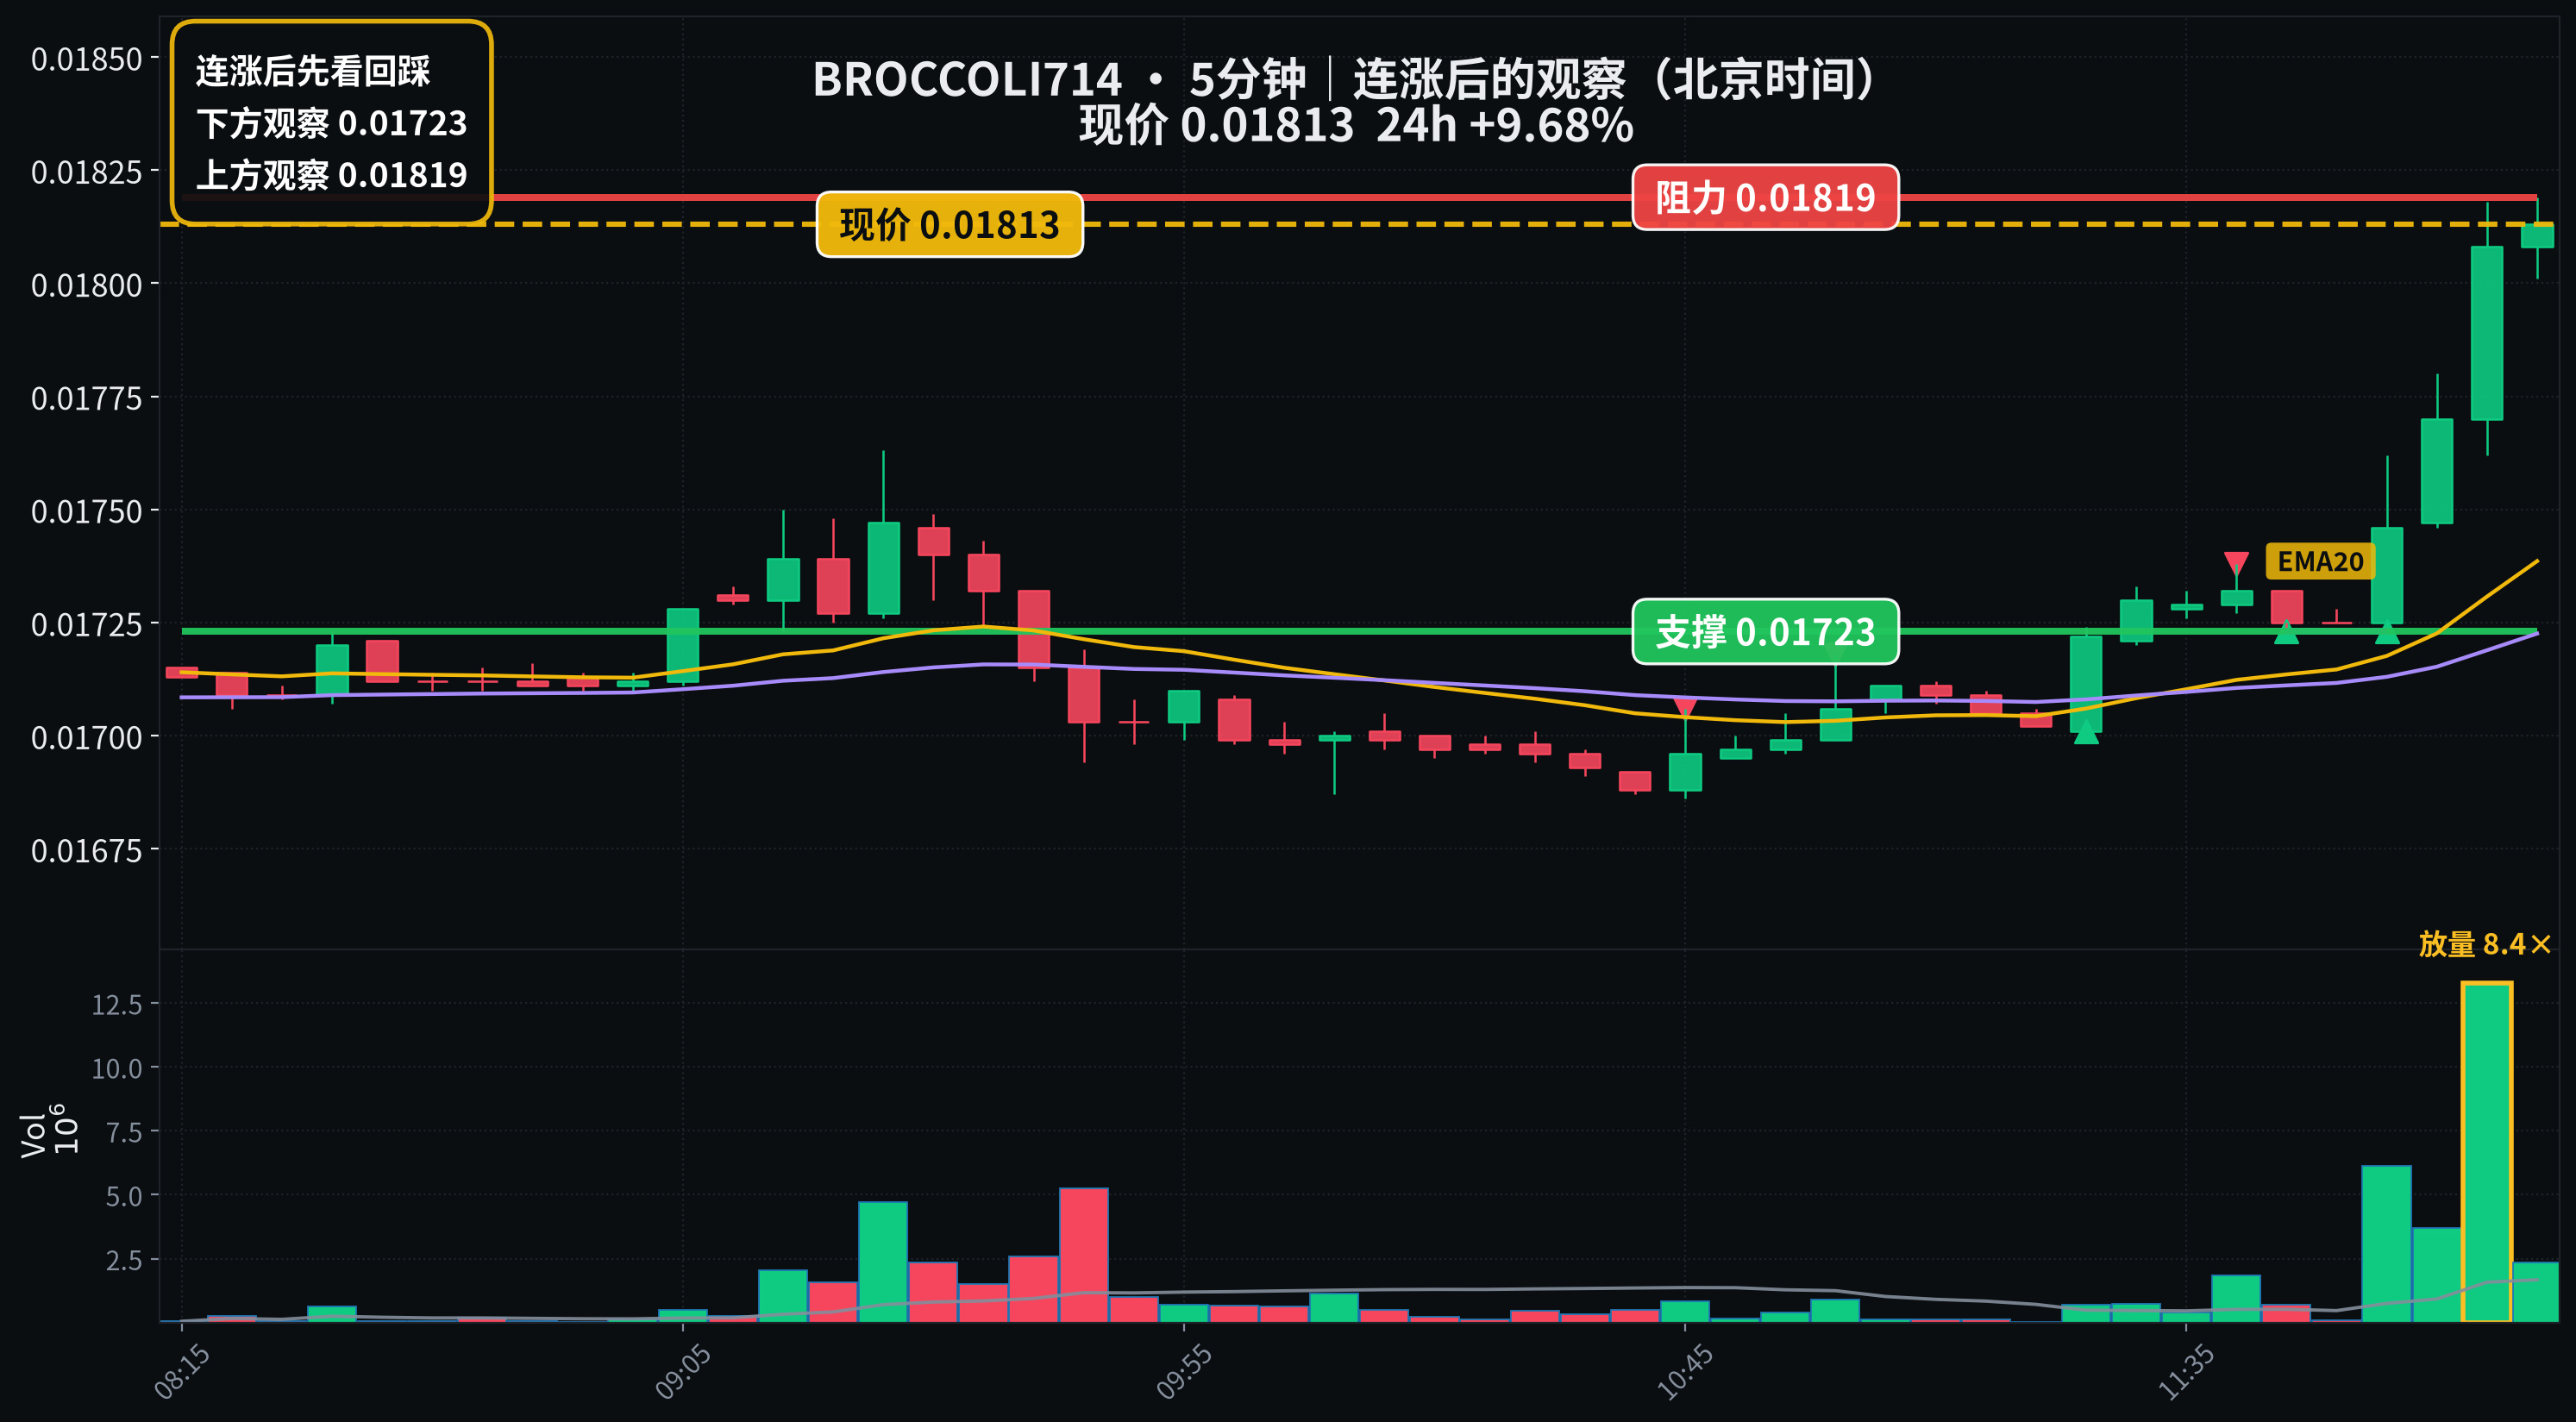
Binance BROCCOLI714USDT perpetual, November 8 Beijing time: the complete hour from 11:00–12:00 rose about 2.77%; the complete five-minute period from 12:00–12:05 rose about 2.15%, and the previous complete five-minute period also rose about 1.32%. The 12:00 hour was still moving up when the chart was captured, but the hourly candle had not yet closed, so its developing gain should not be presented as the final result.
Chart levels: the yellow dashed line marks the chart snapshot at 0.018130. The green line at 0.01723 is a local support level to watch on the chart, and the red line at 0.01819 is local resistance overhead. First watch whether a pullback can hold support, then whether the price can continue to reclaim and hold above resistance; an intraday touch alone does not count as holding.
If the price falls back below support, the short-term move looks more like a failed recovery after a spike. If support holds and a subsequent candle closes above resistance, the uptrend will have greater potential to continue. This discussion is based solely on the structure of publicly available candlesticks; it does not speculate about rally causes without a source, nor does it directly apply spot-market fluctuations to perpetuals.
Be mindful of liquidity, slippage, and leverage risks over the weekend. Data: Binance public candlesticks, November 8, 2026, Beijing time. For market commentary only; not investment advice.
#BROCCOLI714 #MarketAnalysis
Binance BROCCOLI714USDT perpetual, November 8 Beijing time: the complete hour from 11:00–12:00 rose about 2.77%; the complete five-minute period from 12:00–12:05 rose about 2.15%, and the previous complete five-minute period also rose about 1.32%. The 12:00 hour was still moving up when the chart was captured, but the hourly candle had not yet closed, so its developing gain should not be presented as the final result.
Chart levels: the yellow dashed line marks the chart snapshot at 0.018130. The green line at 0.01723 is a local support level to watch on the chart, and the red line at 0.01819 is local resistance overhead. First watch whether a pullback can hold support, then whether the price can continue to reclaim and hold above resistance; an intraday touch alone does not count as holding.
If the price falls back below support, the short-term move looks more like a failed recovery after a spike. If support holds and a subsequent candle closes above resistance, the uptrend will have greater potential to continue. This discussion is based solely on the structure of publicly available candlesticks; it does not speculate about rally causes without a source, nor does it directly apply spot-market fluctuations to perpetuals.
Be mindful of liquidity, slippage, and leverage risks over the weekend. Data: Binance public candlesticks, November 8, 2026, Beijing time. For market commentary only; not investment advice.
#BROCCOLI714 #MarketAnalysis