From a positioning perspective:
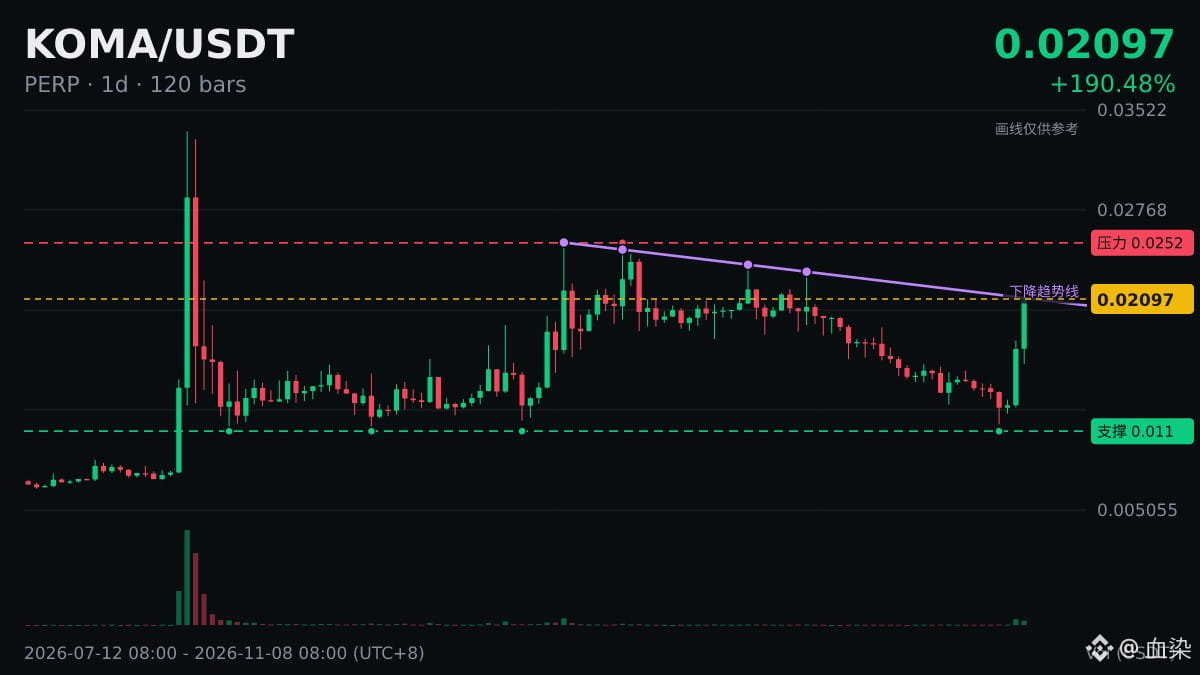
The daily chart for $KOMA has moved above the MA50 (0.01823).
Many trend-following and quantitative funds watch medium- to long-term moving averages like this. Moving above one often attracts momentum buying, so keep an eye on whether volume picks up.
How would you trade it?
The daily chart for $KOMA has moved above the MA50 (0.01823).
Many trend-following and quantitative funds watch medium- to long-term moving averages like this. Moving above one often attracts momentum buying, so keep an eye on whether volume picks up.
How would you trade it?