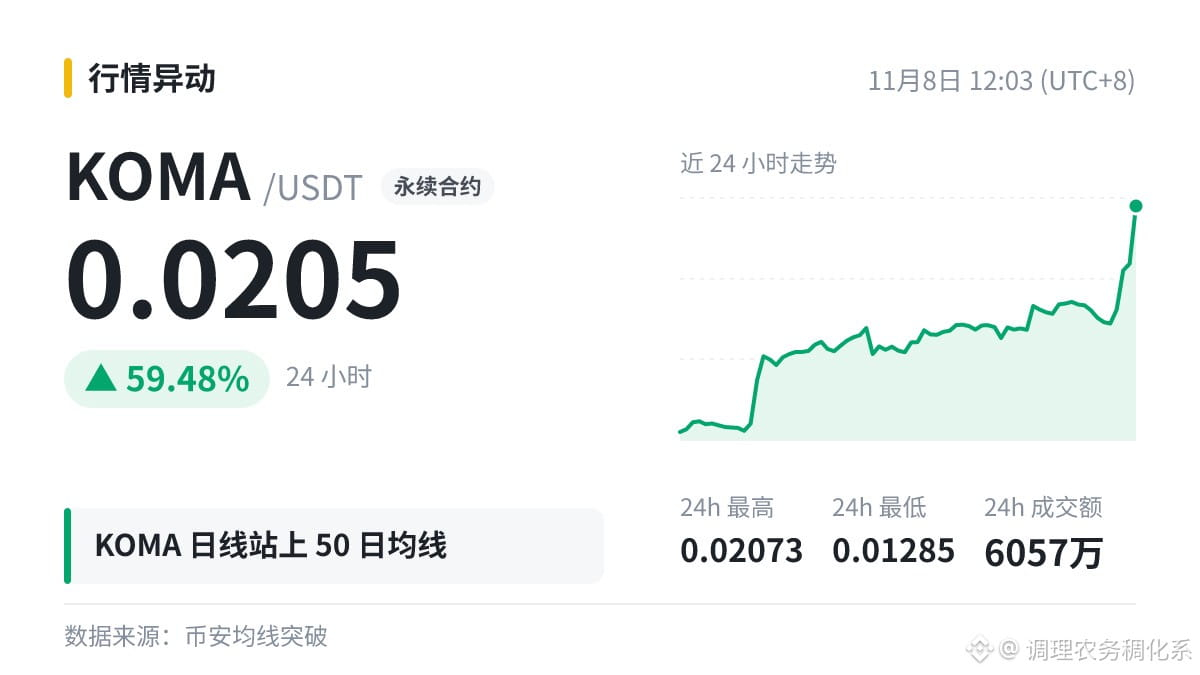
🐋 $KOMA The daily chart is above MA50 (0.01823).
Moving averages on the daily chart are something many medium- and long-term traders refer to, but first, let’s understand how they’re calculated.
On the daily chart, MA200 is the average closing price over the most recent 200 days and is often treated as the dividing line between bull and bear trends; MA50 is commonly used to gauge the medium-term trend.
Comparing multiple data points is more reliable than looking at just one, but even more indicators can’t provide a definitive answer.
Moving averages on the daily chart are something many medium- and long-term traders refer to, but first, let’s understand how they’re calculated.
On the daily chart, MA200 is the average closing price over the most recent 200 days and is often treated as the dividing line between bull and bear trends; MA50 is commonly used to gauge the medium-term trend.
Comparing multiple data points is more reliable than looking at just one, but even more indicators can’t provide a definitive answer.