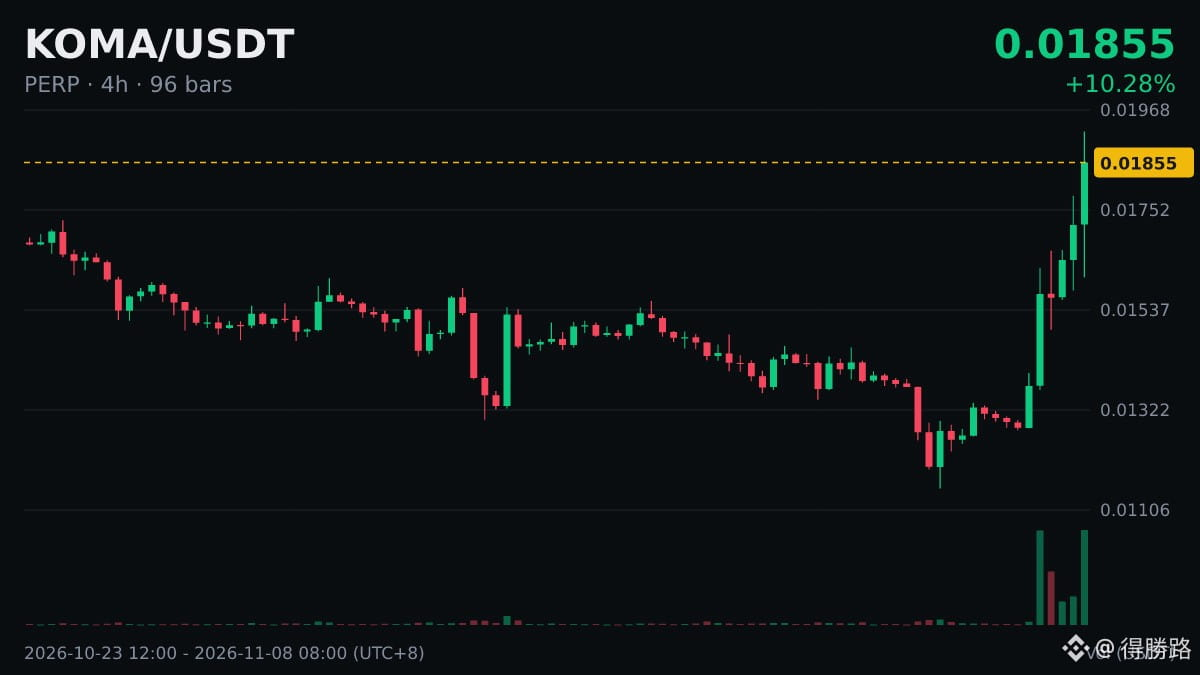
$KOMA 4-hour RSI is 79.9, in overbought territory.
Let’s use this data to break down RSI.
RSI is calculated using closing prices only. It doesn’t take trading volume into account or reflect intraday wicks.
Extreme readings on the daily chart usually carry more weight than those on the 4-hour chart. Readings occur more frequently on shorter timeframes, and there’s more noise.
Don’t place trades during the most volatile minutes. Wait for the candle to close before taking a look.
I’m just sharing my thoughts; this is not investment advice.
Let’s use this data to break down RSI.
RSI is calculated using closing prices only. It doesn’t take trading volume into account or reflect intraday wicks.
Extreme readings on the daily chart usually carry more weight than those on the 4-hour chart. Readings occur more frequently on shorter timeframes, and there’s more noise.
Don’t place trades during the most volatile minutes. Wait for the candle to close before taking a look.
I’m just sharing my thoughts; this is not investment advice.