🚨 Horizen ($ZEN ) Technical Outlook: Short-Term Rebound or Continued Bearish Pressure? 📉📈
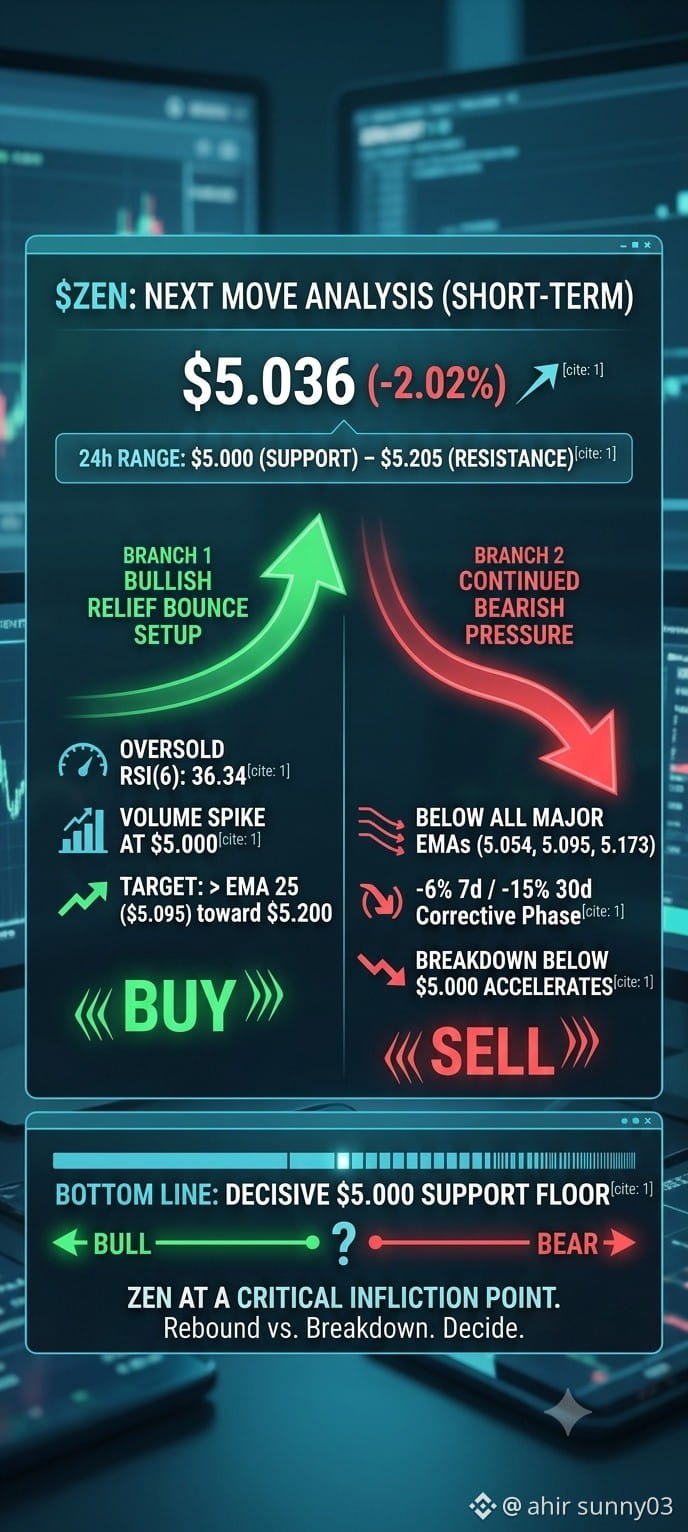
Current Price: $5.036 (-2.02%)
24h Range: High $5.205 / Low $5.000
RSI (6): 36.34 (Approaching the oversold zone)
24h Trading Volume: 150,655.05 ZEN (~$767,668.90 USDT)
📊 Technical Breakdown & Next Move Analysis:
Bearish Indicators:
Price action is currently trading below key moving averages and Exponential Moving Averages (EMA 7: 5.054, EMA 25: 5.095, EMA 99: 5.173), signaling lingering downward momentum.
7-day (-6.01%) and 30-day (-15.39%) performance reflects a steady macro corrective phase.
.
Bullish Rebound Signals:
Oversold RSI: With the RSI(6) dipping near 36.34, selling pressure is starting to exhaust, creating a setup for a potential relief bounce.
Volume Spike: A noticeable volume surge on the latest green candle indicates buyers stepping in near the psychological $5.00 support floor.
.
💡 Strategic Outlook:
Bullish Scenario: If $ZEN holds the $5.00 floor and breaks above the immediate EMA 7 / EMA 25 resistance cluster (~$5.05 – $5.10), we could see a relief rally toward $5.20.
Bearish Scenario: A decisive breakdown below $5.00 support could accelerate losses, inviting deeper re-tests of lower historical bounds.
Are you anticipating a bullish reversal from this support or preparing for further downside? Drop your analysis below! 👇
#zen #horizen #BinanceSquare #TechnicalAnalysis #cryptotrading
Current Price: $5.036 (-2.02%)
24h Range: High $5.205 / Low $5.000
RSI (6): 36.34 (Approaching the oversold zone)
24h Trading Volume: 150,655.05 ZEN (~$767,668.90 USDT)
📊 Technical Breakdown & Next Move Analysis:
Bearish Indicators:
Price action is currently trading below key moving averages and Exponential Moving Averages (EMA 7: 5.054, EMA 25: 5.095, EMA 99: 5.173), signaling lingering downward momentum.
7-day (-6.01%) and 30-day (-15.39%) performance reflects a steady macro corrective phase.
.
Bullish Rebound Signals:
Oversold RSI: With the RSI(6) dipping near 36.34, selling pressure is starting to exhaust, creating a setup for a potential relief bounce.
Volume Spike: A noticeable volume surge on the latest green candle indicates buyers stepping in near the psychological $5.00 support floor.
.
💡 Strategic Outlook:
Bullish Scenario: If $ZEN holds the $5.00 floor and breaks above the immediate EMA 7 / EMA 25 resistance cluster (~$5.05 – $5.10), we could see a relief rally toward $5.20.
Bearish Scenario: A decisive breakdown below $5.00 support could accelerate losses, inviting deeper re-tests of lower historical bounds.
Are you anticipating a bullish reversal from this support or preparing for further downside? Drop your analysis below! 👇
#zen #horizen #BinanceSquare #TechnicalAnalysis #cryptotrading