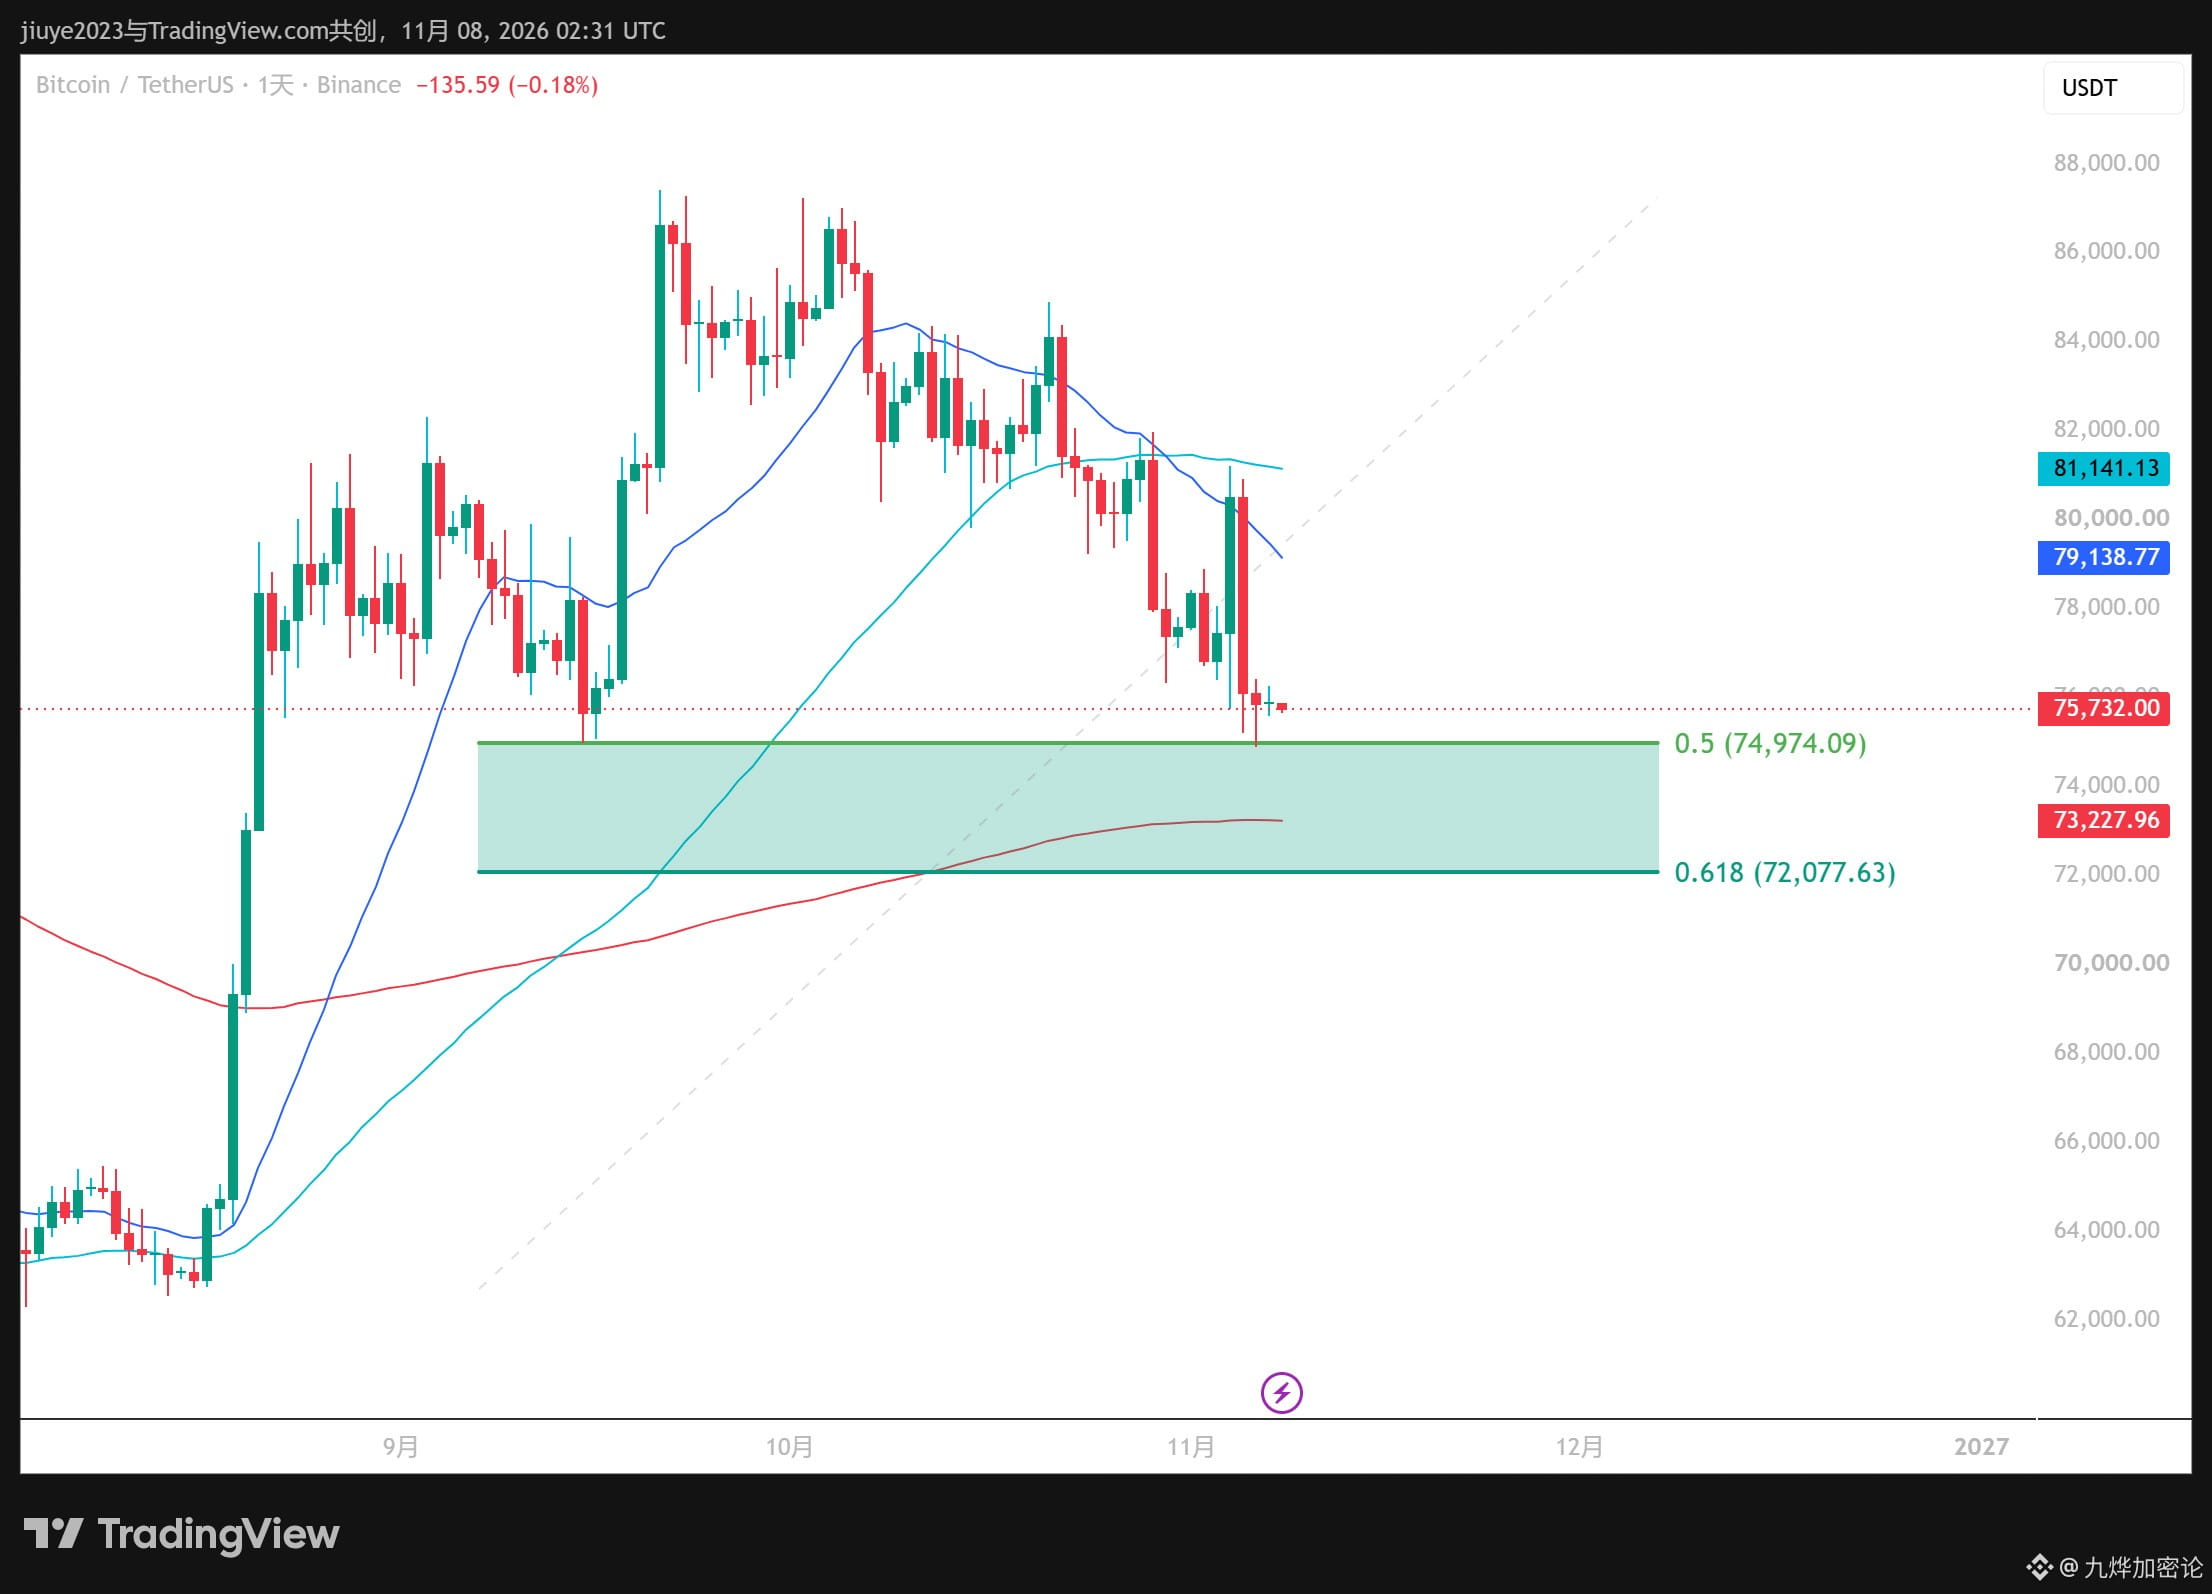
75K, 73K, and 72K are dense short-term support zones, based mainly on the 50% Fibonacci level, the 200-day moving average, and the 61.8% Fibonacci level. Our benchmark has always been the 200-day moving average at 73.3K, which has historically marked the divide between bull and bear markets.
At the moment, there are still no signs of a bottom. Those who entered earlier are having a tough time. I estimate we’ll see another month or so of choppy trading, followed by a sharp drop and recovery.
$BTC
At the moment, there are still no signs of a bottom. Those who entered earlier are having a tough time. I estimate we’ll see another month or so of choppy trading, followed by a sharp drop and recovery.
$BTC