$BMT
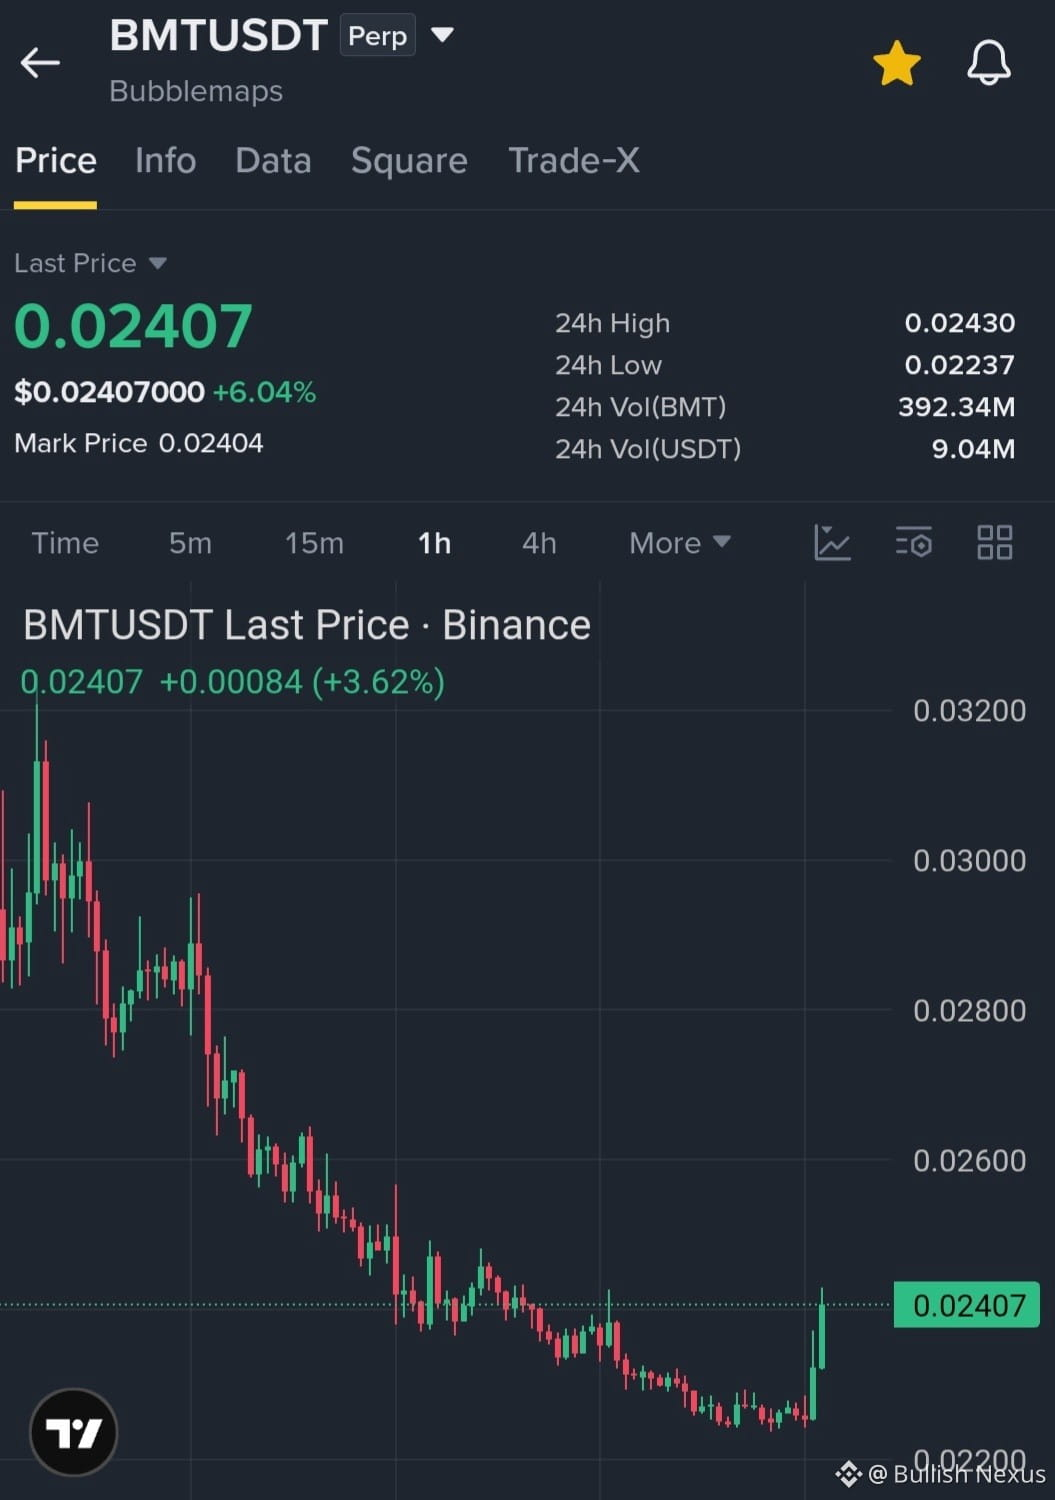
🚀 BMT/USDT Technical Breakdown & Long Setup (1H & 4H Analysis) 📈
$BMT is showing strong bullish momentum after breaking out of its recent local downtrend structure. Here is how I am playing this move:
📊 Market Structure:
1H Chart: Experiencing a sharp impulse breakout with moving averages crossing upward. RSI(6) is currently overbought (~85.22), signaling that a healthy short-term pullback or consolidation is likely before the next leg up.
4H Chart: Showing a solid recovery attempt from the local low of $0.02042, currently testing overhead resistance near the 4H moving averages. RSI is neutral-bullish (~59.14), leaving plenty of room for expansion.
🎯 Trade Setup (Long Plan):
Since chasing a high-RSI breakout carries short-term risk, patience for a retest is key.
Entry Zone (DCA / Limit): $0.02280 – $0.02310 (retest of previous breakout structure / rising 1H MAs)
Take-Profit Targets:
TP1: $0.02520 (4H MA resistance)
TP2: $0.02740
TP3: $0.02930 – $0.03070 (Major liquidity & previous highs)
Stop-Loss: $0.02190 (Strict invalidation below local swing low)
⚠️ Manage your risk properly and scale in at key support levels!
#BMTUSDT
🚀 BMT/USDT Technical Breakdown & Long Setup (1H & 4H Analysis) 📈
$BMT is showing strong bullish momentum after breaking out of its recent local downtrend structure. Here is how I am playing this move:
📊 Market Structure:
1H Chart: Experiencing a sharp impulse breakout with moving averages crossing upward. RSI(6) is currently overbought (~85.22), signaling that a healthy short-term pullback or consolidation is likely before the next leg up.
4H Chart: Showing a solid recovery attempt from the local low of $0.02042, currently testing overhead resistance near the 4H moving averages. RSI is neutral-bullish (~59.14), leaving plenty of room for expansion.
🎯 Trade Setup (Long Plan):
Since chasing a high-RSI breakout carries short-term risk, patience for a retest is key.
Entry Zone (DCA / Limit): $0.02280 – $0.02310 (retest of previous breakout structure / rising 1H MAs)
Take-Profit Targets:
TP1: $0.02520 (4H MA resistance)
TP2: $0.02740
TP3: $0.02930 – $0.03070 (Major liquidity & previous highs)
Stop-Loss: $0.02190 (Strict invalidation below local swing low)
⚠️ Manage your risk properly and scale in at key support levels!
#BMTUSDT