$MET , this chart is full of traps, and the shorts are getting roasted.
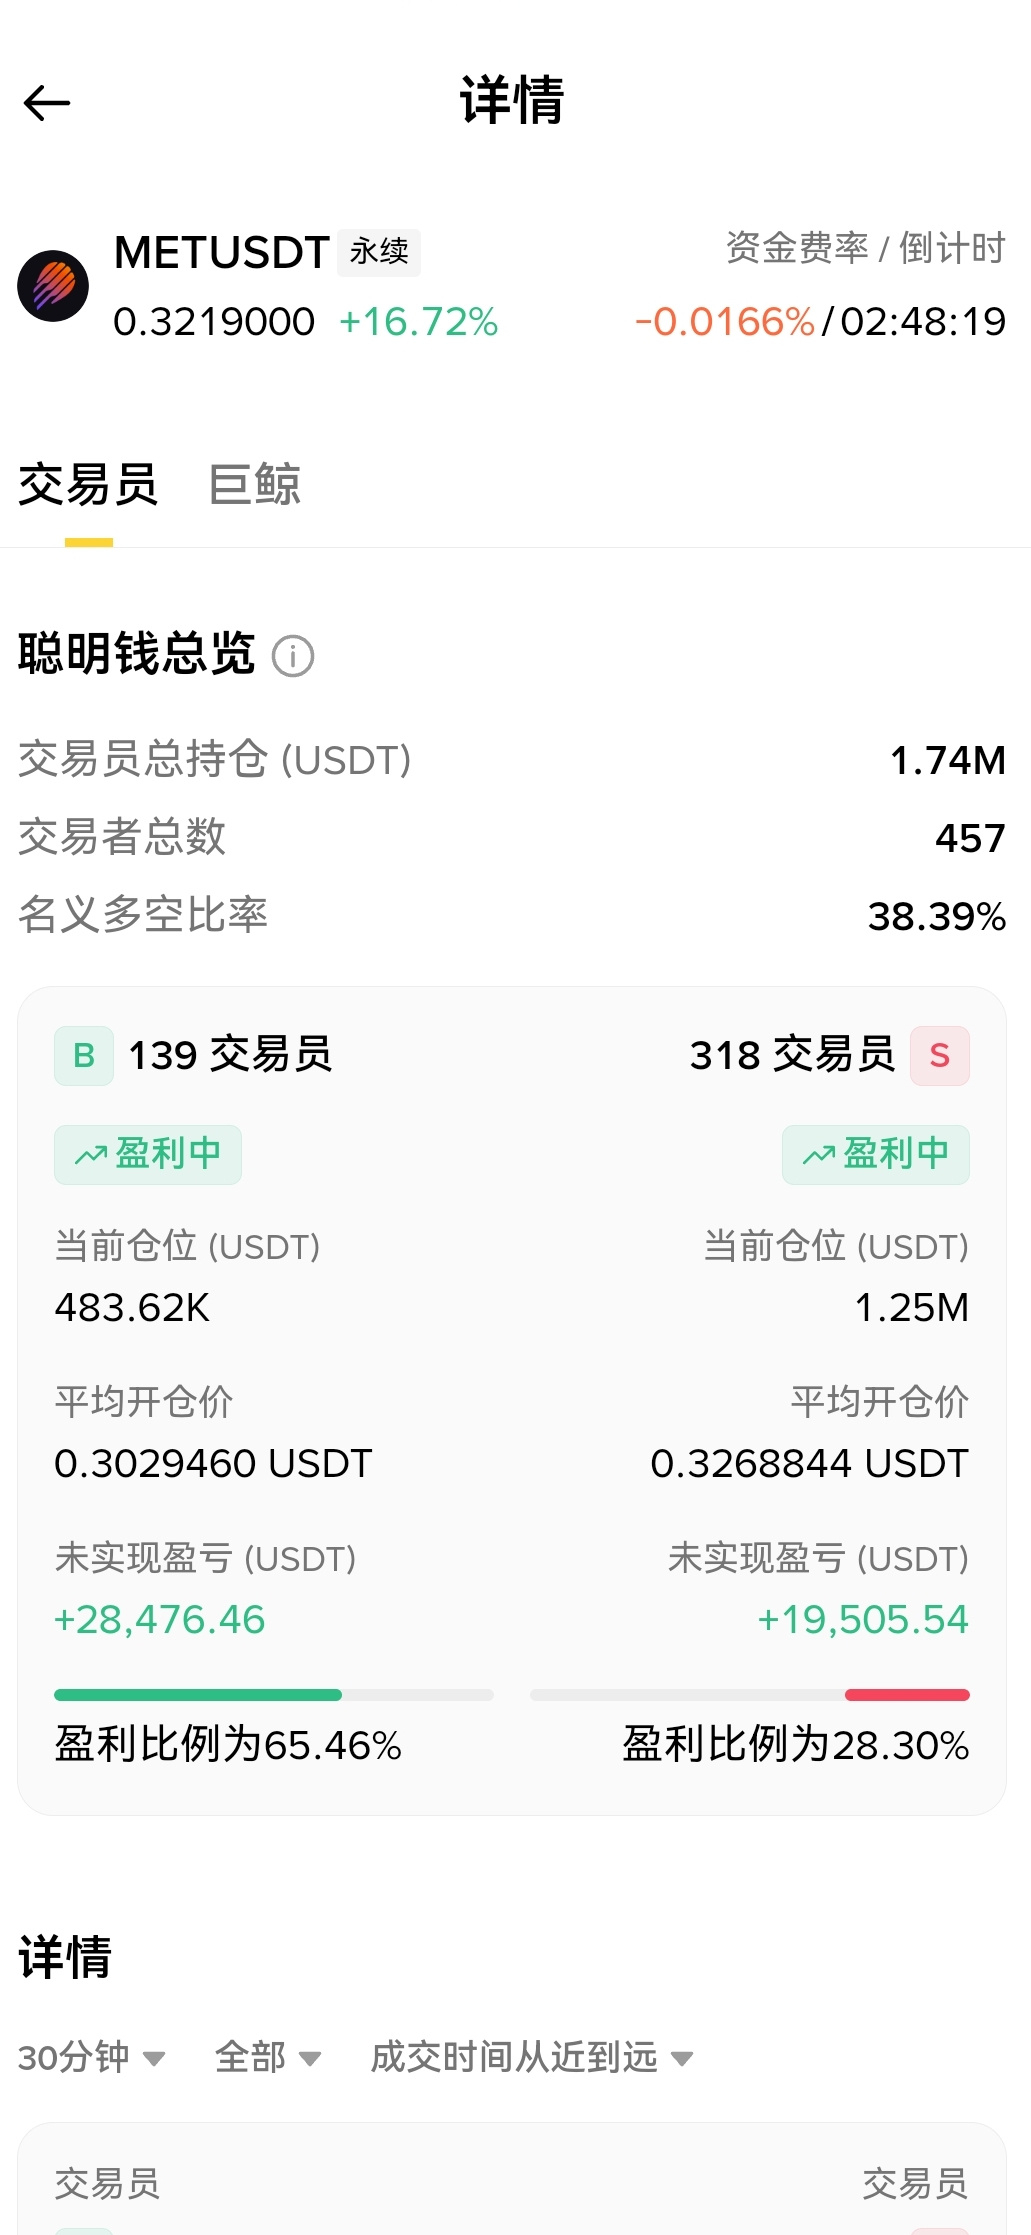
Look at the data: 318 shorts are pressing down on 139 longs. As if having more of them weren't enough, the funding rate is also negative (-0.0166%), which means the shorts are all paying to hold their positions! The average long entry is 0.30, the average short entry is 0.32, and the current price is 0.32. That means retail traders who just chased the short trade are all trapped.
Look at the chart: a huge volume spike on the 4-hour chart has blasted straight through all the moving averages. But note that the 4-hour RSI is already at 76, so it’s a little overbought in the short term.
My take: chasing longs at the current price could easily get you caught in a pullback, while shorting right now is asking for trouble. The safest move is to wait for a pullback.
Wait for it to dip to 0.305 - 0.310 (moving-average support + the longs’ cost zone), then go long. Set your stop at 0.29. First target: 0.335; if it breaks through, it could liquidate the shorts above. $MET
Look at the data: 318 shorts are pressing down on 139 longs. As if having more of them weren't enough, the funding rate is also negative (-0.0166%), which means the shorts are all paying to hold their positions! The average long entry is 0.30, the average short entry is 0.32, and the current price is 0.32. That means retail traders who just chased the short trade are all trapped.
Look at the chart: a huge volume spike on the 4-hour chart has blasted straight through all the moving averages. But note that the 4-hour RSI is already at 76, so it’s a little overbought in the short term.
My take: chasing longs at the current price could easily get you caught in a pullback, while shorting right now is asking for trouble. The safest move is to wait for a pullback.
Wait for it to dip to 0.305 - 0.310 (moving-average support + the longs’ cost zone), then go long. Set your stop at 0.29. First target: 0.335; if it breaks through, it could liquidate the shorts above. $MET