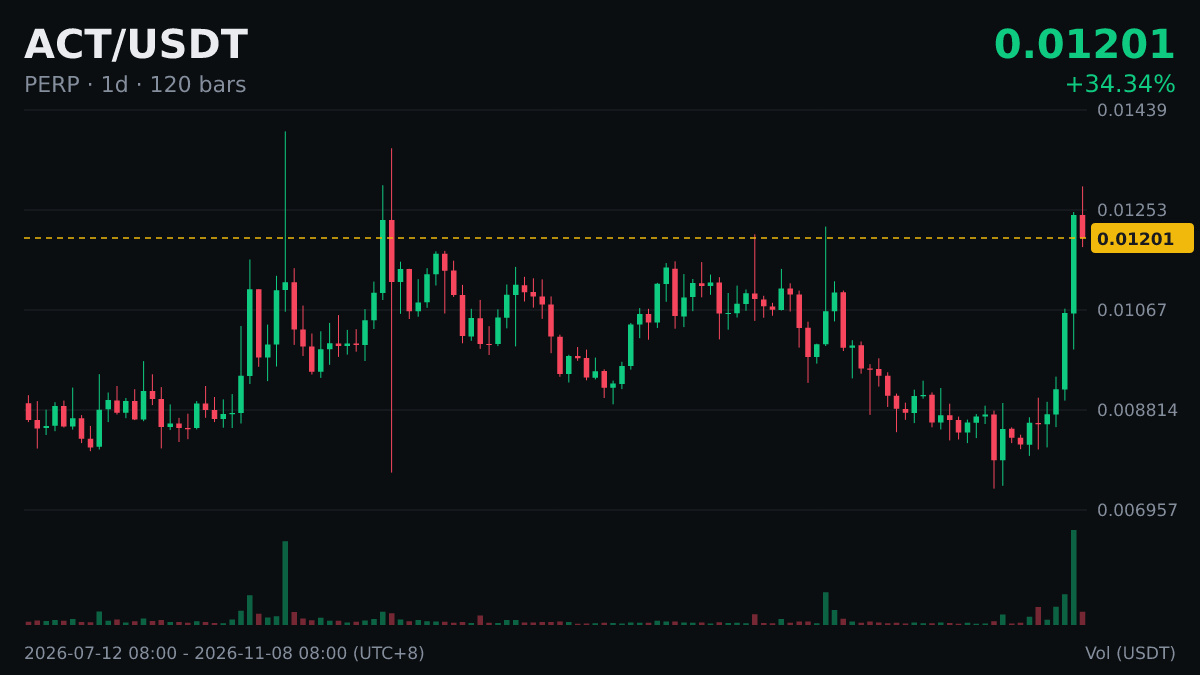
$ACT moved above MA200 on the daily chart (0.01065).
Let's break this number down.
The moving average's own slope is also worth watching: a price moving above it while it's still trending downward means something different from one moving above it as it starts to turn upward.
Indicators can fail, so don't skip the stop-loss: deciding in advance what to do if you're wrong matters more than getting the prediction right.
Let's break this number down.
The moving average's own slope is also worth watching: a price moving above it while it's still trending downward means something different from one moving above it as it starts to turn upward.
Indicators can fail, so don't skip the stop-loss: deciding in advance what to do if you're wrong matters more than getting the prediction right.