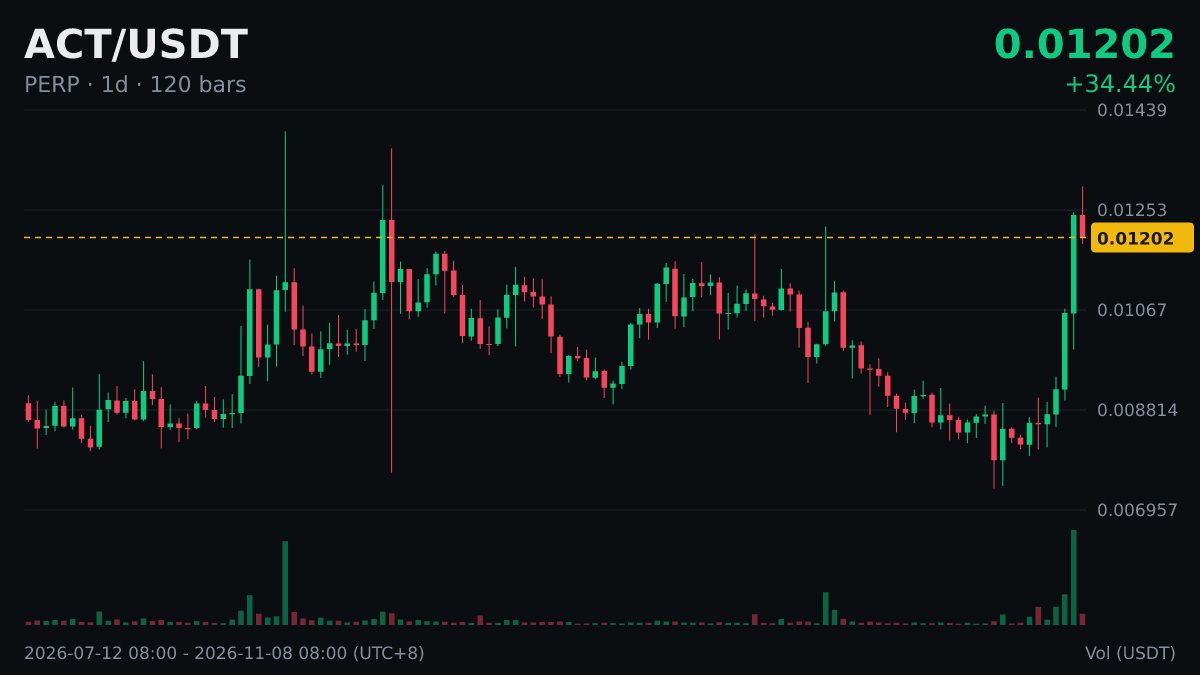
$ACT The daily chart has moved above MA200 (0.01065), with the current price at 0.01203.
The daily MA200 has long been seen as the dividing line between bull and bear markets. After moving above it, the key is whether a pullback finds support near the moving average; if it holds, the trend will strengthen.
Moving averages naturally lag, so don't expect them to pinpoint the highs and lows. In one sentence, what's your take right now?
The daily MA200 has long been seen as the dividing line between bull and bear markets. After moving above it, the key is whether a pullback finds support near the moving average; if it holds, the trend will strengthen.
Moving averages naturally lag, so don't expect them to pinpoint the highs and lows. In one sentence, what's your take right now?