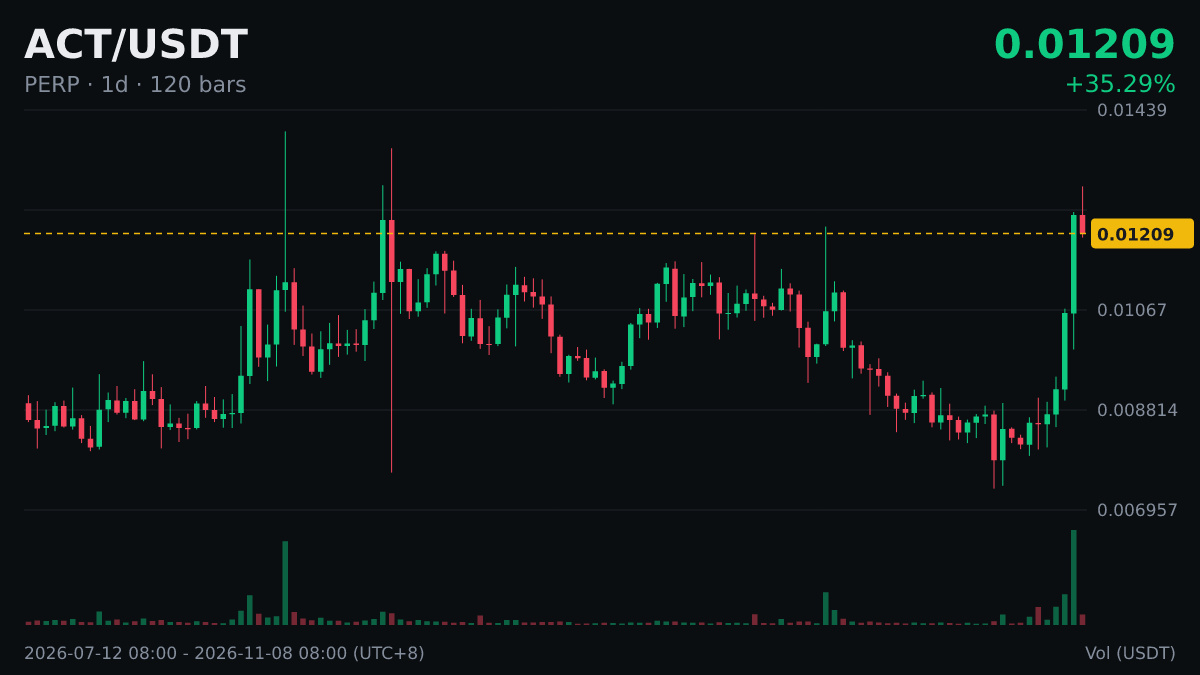
Don't panic—watch me: $ACT 's daily chart is above MA50 (0.009808), up 15.05% over 24h.
Moving averages are naturally a little slow to react, just like me when making decisions.
For a bit of educational info: moving averages come in two types, simple and exponential. MA usually refers to a simple moving average, where each candlestick has equal weight; EMA gives more weight to recent prices.
All these figures only summarize past trends, and the market could just as easily move in the opposite direction.
I'm just chatting—don't take this as investment advice.
Moving averages are naturally a little slow to react, just like me when making decisions.
For a bit of educational info: moving averages come in two types, simple and exponential. MA usually refers to a simple moving average, where each candlestick has equal weight; EMA gives more weight to recent prices.
All these figures only summarize past trends, and the market could just as easily move in the opposite direction.
I'm just chatting—don't take this as investment advice.