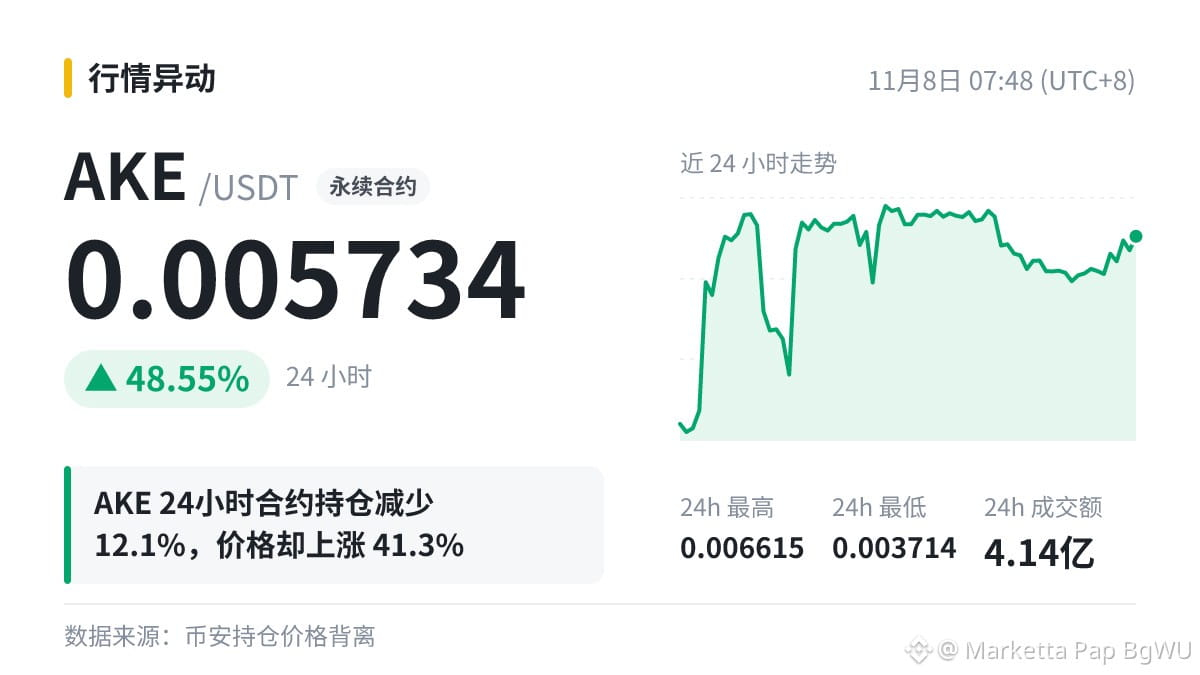
I used to look only at candlestick charts, but later learned to check them alongside open interest. $AKE is a good example:
Looking only at the chart, it was up 41.32% in 24 hours, so I thought new money was buying in. But when I checked open interest, I saw it was down 12.11%—more likely shorts closing their positions.
Do you usually compare price action with open interest?
Looking only at the chart, it was up 41.32% in 24 hours, so I thought new money was buying in. But when I checked open interest, I saw it was down 12.11%—more likely shorts closing their positions.
Do you usually compare price action with open interest?