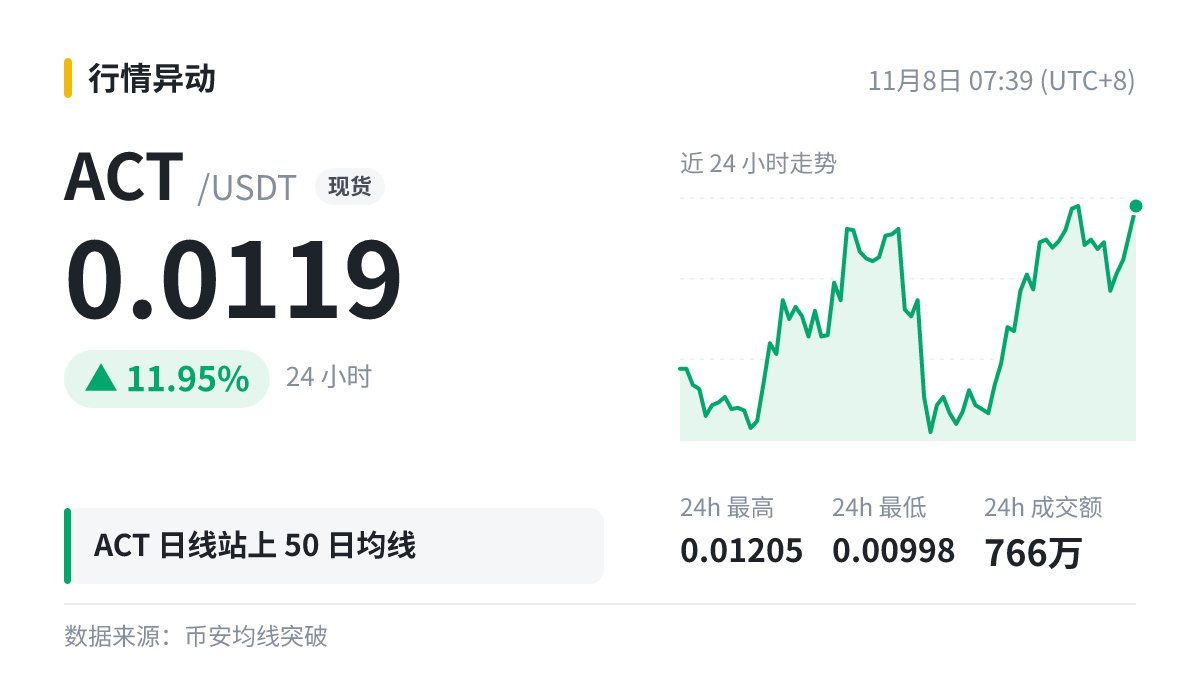
$ACT The daily chart is above MA50 (0.009808).
Where does this number come from?
Long-term moving averages like the MA200 attract widespread attention partly because so many people watch them. When the price gets close, reactions are often more dramatic.
Knowing how to read indicators is easy; the hard part is sticking to your plan when the market is at its most extreme.
Where does this number come from?
Long-term moving averages like the MA200 attract widespread attention partly because so many people watch them. When the price gets close, reactions are often more dramatic.
Knowing how to read indicators is easy; the hard part is sticking to your plan when the market is at its most extreme.