$ETH Crypto Academician: 11.8 Ethereum (ETH) daily doji + 4-hour bearish alignment: At 2239, bulls and bears are both waiting for the other to make the first move
What I really want to say at the outset is this: the essence of trading is not prediction, but response. At 2239, neither bulls nor bears have a decisive edge. It comes down to who has the tighter stop-loss, the smaller position, and the greater patience. I post updates on key-level movements and structural developments in my Moments every day. No grand promises, no screenshots of 100x gains—just signals from multi-timeframe confluence and TD counts. This method won’t make you rich overnight, but in a market where seven lose, two break even, and one profits, it can help you get onto the list of potential winners. The above is my personal technical review, not investment advice. If trading futures with leverage, be sure to keep it within a level where you can afford liquidation.
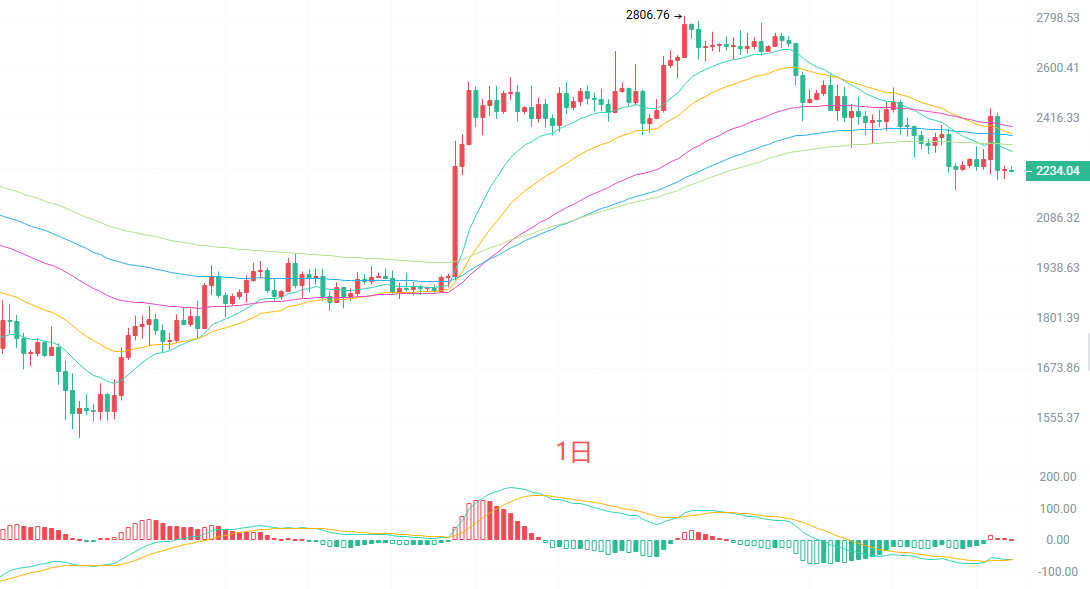
The daily candlestick chart shows a typical low-volume doji following a decline. Structurally, the price has already fallen below EMA15 and the Bollinger Band middle line at 2325, but EMA120, currently at 2326, is still slowly turning upward, so the medium-term bullish trend is not completely dead. MACD has only just turned upward below the zero line, indicating a weak recovery, not a reversal signal. The 2325–2362 zone overhead is a dense area of trapped buyers; the lower Bollinger Band at 2174 and the previous low at 2172 are the bulls’ last line of defense. On the daily timeframe, the two scenarios—a continuation of the decline and the formation of an early double bottom—are now battling it out. A high-volume bullish candle is needed to invalidate the bearish scenario.
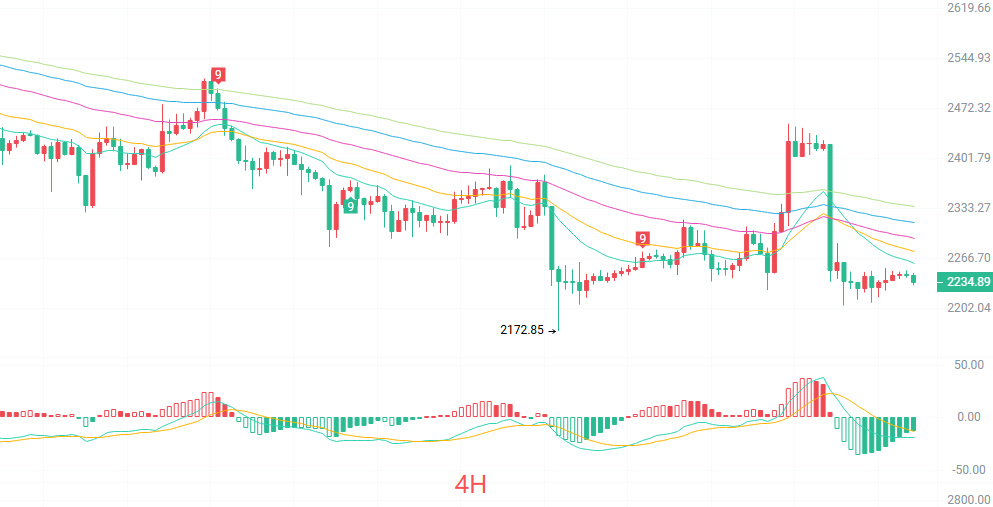
On the 4-hour chart, the price rebounded to 2430 before falling back for a second time, and is now moving sideways at 2239. The price is below EMA15, while the short-term moving averages EMA30/60/90/120 are all bearishly aligned and diverging downward—a textbook downtrend structure. One notable point about MACD is that it did not make a new high in step with the 2430 peak of this rebound, forming a hidden bearish divergence and indicating that upward momentum has already faded. The Bollinger Bands are narrowing, and the middle line at 2298 has turned from support into resistance. The current outlook is weak, range-bound, and biased to the downside.
Short-term reference:
Long: Look for support in the 2210–2180 range; stop-loss at 30 points; targets at 2300–2350.
Short: Look for stalling in the 2270–2300 range; stop-loss at 30 points; targets at 2240–2190.
Base specific trades on real-time order book data. For more information, feel free to contact the author. This article may be published with a delay; these suggestions are for reference only, and you assume all risk.
#ETH走势分析
What I really want to say at the outset is this: the essence of trading is not prediction, but response. At 2239, neither bulls nor bears have a decisive edge. It comes down to who has the tighter stop-loss, the smaller position, and the greater patience. I post updates on key-level movements and structural developments in my Moments every day. No grand promises, no screenshots of 100x gains—just signals from multi-timeframe confluence and TD counts. This method won’t make you rich overnight, but in a market where seven lose, two break even, and one profits, it can help you get onto the list of potential winners. The above is my personal technical review, not investment advice. If trading futures with leverage, be sure to keep it within a level where you can afford liquidation.
The daily candlestick chart shows a typical low-volume doji following a decline. Structurally, the price has already fallen below EMA15 and the Bollinger Band middle line at 2325, but EMA120, currently at 2326, is still slowly turning upward, so the medium-term bullish trend is not completely dead. MACD has only just turned upward below the zero line, indicating a weak recovery, not a reversal signal. The 2325–2362 zone overhead is a dense area of trapped buyers; the lower Bollinger Band at 2174 and the previous low at 2172 are the bulls’ last line of defense. On the daily timeframe, the two scenarios—a continuation of the decline and the formation of an early double bottom—are now battling it out. A high-volume bullish candle is needed to invalidate the bearish scenario.
On the 4-hour chart, the price rebounded to 2430 before falling back for a second time, and is now moving sideways at 2239. The price is below EMA15, while the short-term moving averages EMA30/60/90/120 are all bearishly aligned and diverging downward—a textbook downtrend structure. One notable point about MACD is that it did not make a new high in step with the 2430 peak of this rebound, forming a hidden bearish divergence and indicating that upward momentum has already faded. The Bollinger Bands are narrowing, and the middle line at 2298 has turned from support into resistance. The current outlook is weak, range-bound, and biased to the downside.
Short-term reference:
Long: Look for support in the 2210–2180 range; stop-loss at 30 points; targets at 2300–2350.
Short: Look for stalling in the 2270–2300 range; stop-loss at 30 points; targets at 2240–2190.
Base specific trades on real-time order book data. For more information, feel free to contact the author. This article may be published with a delay; these suggestions are for reference only, and you assume all risk.
#ETH走势分析