$BTC Crypto Academician: The Cruelest Thing About This Bitcoin (BTC) Drop on Nov. 8: It Gives You No Chance to Exit on a Rebound
Technical analysis is effective because of consistency, not win rate. All parameters in this article come from real-time readings of the current candlestick. If any one of the TD sequence, EMA, MACD, or BOLL indicators fails, the framework is immediately invalidated. Trading is a game of probabilities, and stop-losses are the only variable you can control. These are personal research notes and do not constitute investment advice. Please make your own decisions when trading contracts with high leverage. If you find this framework useful, feel free to follow me; I’ll share an update as soon as the next dual-timeframe resonance occurs.
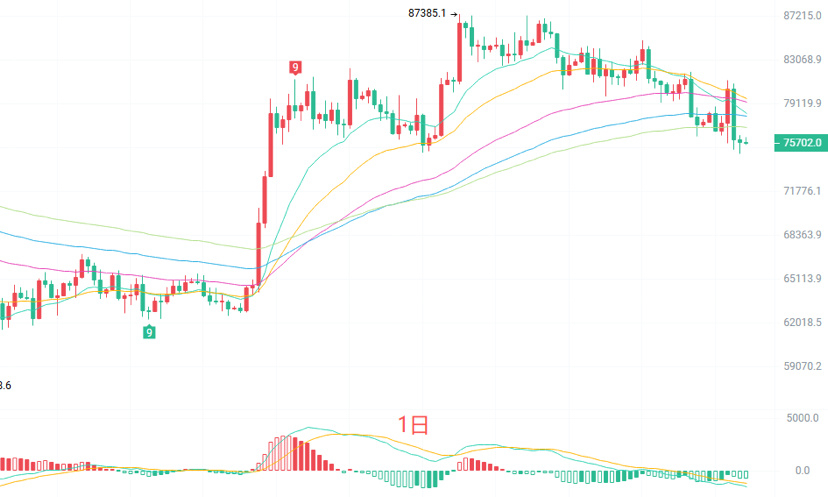
The daily candlestick has fallen below all five EMA lines, which are bearishly aligned: the shortest-term average is at the bottom and the longest-term one is at the top. This is the weakest structure. The MACD histogram bars are still growing, indicating that downward momentum has not yet faded. The Bollinger middle band at 79407 has become resistance, while the lower band at 74570 is the only support below. The TD top countdown is on its third bar, so the daily correction is not over yet.
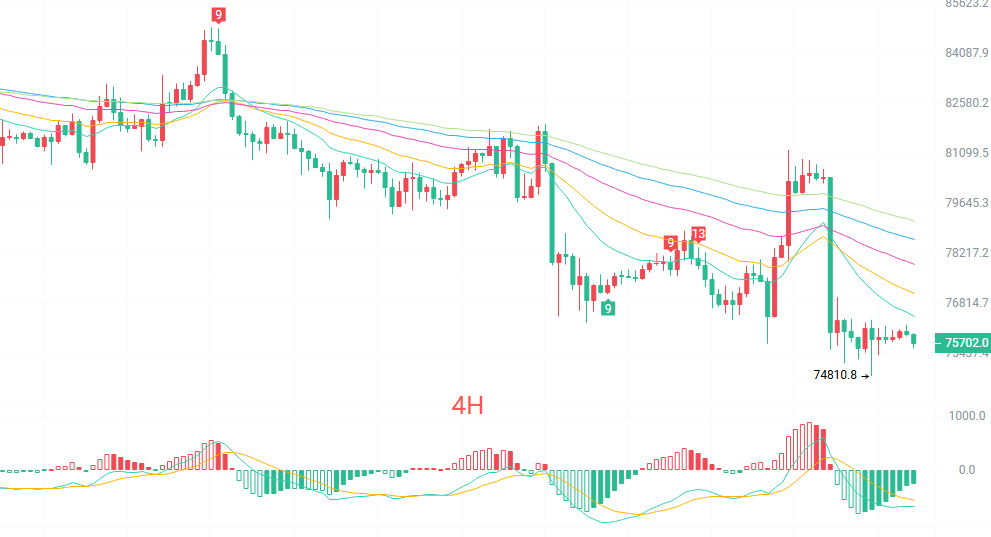
The large bearish four-hour candlestick on November 5 plunged directly from 78500 to 74810. The next three candles then moved sideways on lower volume near 75700, without even reaching the EMA15 at 76465. A sharp drop followed by no rebound is usually a continuation of the downtrend, not a sign of a bottom. The moving averages are likewise bearishly aligned, with the EMA30, EMA60, and EMA90 pressing down in succession. The MACD has turned down again below the zero line, with bears still in control in the short term. The Bollinger Bands are widening downward; the middle band at 77374 is the short-term bull-bear dividing line, while the lower band at 73342 is the target in an extreme scenario.
Short-term reference:
Long: support in the 75200–74700 area; stop-loss 500 points; target 77000–78500.
Short: resistance in the 78500–79000 area; stop-loss 500 points; target 77500–76500.
For specific trades, refer primarily to real-time order-book data. For more information, please contact the author. This article may be published with a delay and is for reference only; assume all risks yourself.
#BTC走势分析
Technical analysis is effective because of consistency, not win rate. All parameters in this article come from real-time readings of the current candlestick. If any one of the TD sequence, EMA, MACD, or BOLL indicators fails, the framework is immediately invalidated. Trading is a game of probabilities, and stop-losses are the only variable you can control. These are personal research notes and do not constitute investment advice. Please make your own decisions when trading contracts with high leverage. If you find this framework useful, feel free to follow me; I’ll share an update as soon as the next dual-timeframe resonance occurs.
The daily candlestick has fallen below all five EMA lines, which are bearishly aligned: the shortest-term average is at the bottom and the longest-term one is at the top. This is the weakest structure. The MACD histogram bars are still growing, indicating that downward momentum has not yet faded. The Bollinger middle band at 79407 has become resistance, while the lower band at 74570 is the only support below. The TD top countdown is on its third bar, so the daily correction is not over yet.
The large bearish four-hour candlestick on November 5 plunged directly from 78500 to 74810. The next three candles then moved sideways on lower volume near 75700, without even reaching the EMA15 at 76465. A sharp drop followed by no rebound is usually a continuation of the downtrend, not a sign of a bottom. The moving averages are likewise bearishly aligned, with the EMA30, EMA60, and EMA90 pressing down in succession. The MACD has turned down again below the zero line, with bears still in control in the short term. The Bollinger Bands are widening downward; the middle band at 77374 is the short-term bull-bear dividing line, while the lower band at 73342 is the target in an extreme scenario.
Short-term reference:
Long: support in the 75200–74700 area; stop-loss 500 points; target 77000–78500.
Short: resistance in the 78500–79000 area; stop-loss 500 points; target 77500–76500.
For specific trades, refer primarily to real-time order-book data. For more information, please contact the author. This article may be published with a delay and is for reference only; assume all risks yourself.
#BTC走势分析