Many people tend to mention $XLM and $XRP together: one is in cross-border payments, and so is the other. Their price movements are often described as “pretty similar.” I compared their daily candles on Binance over the past 180 days. They really are pretty similar—but that small difference matters.
First, the “pretty similar” part: over those 180 days, the two coins moved in the same direction on 145 days.
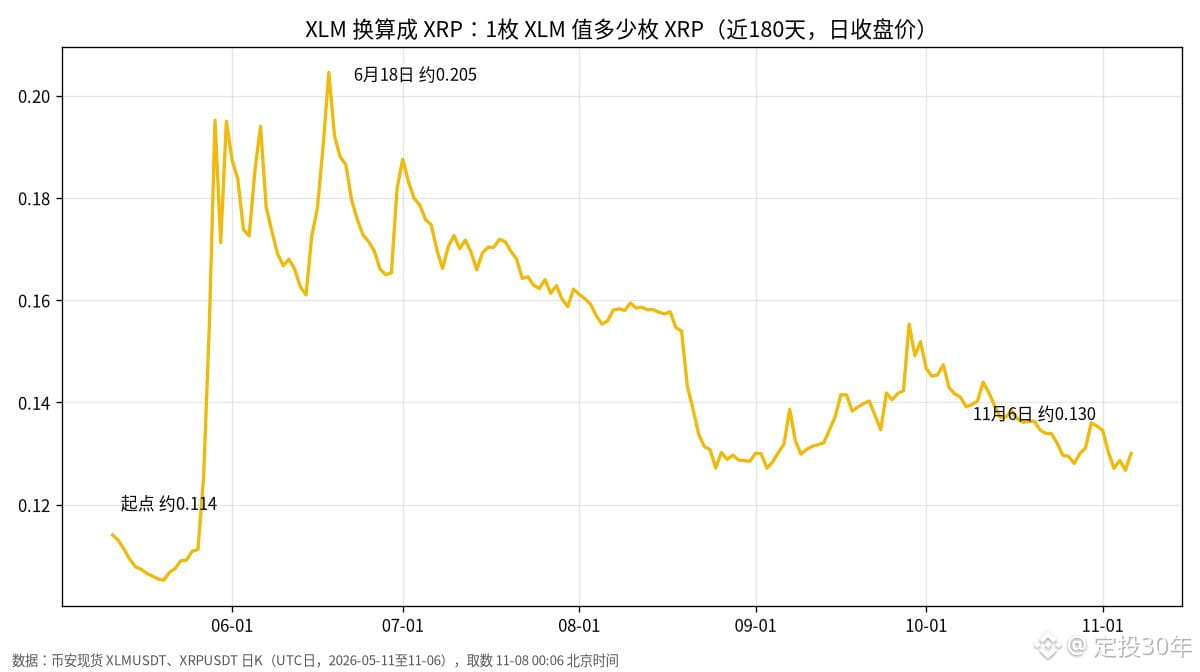
Now for the difference. The line in the chart shows how many XRP one XLM could buy at the closing price. It was about 0.114 on May 11, hit a low of around 0.105 on May 20, and then XLM suddenly took off on its own, surging to about 0.205 on June 18—roughly doubling.
After that, it gradually drifted back down. By November 6, the ratio was about 0.130, around 36% below its June peak.
Looking at the whole period, XLM fell from around 0.1696 USDT to about 0.1533, a drop of roughly 9.6%; XRP fell from around 1.4735 to about 1.179, a drop of roughly 20.0%. XLM fell less, largely thanks to its independent rally in May and June.
It also has a more volatile temperament. Based on daily price changes, XLM’s daily volatility was about 4.7%, compared with about 3.1% for XRP.
So “moving in the same direction” doesn’t mean “moving by the same amount.” If you’re thinking of using one spot asset as a substitute for the other, consider whether you can handle it suddenly surging on its own for a while, then slowly giving those gains back. If you trade futures, take note: holding both coins together doesn’t diversify much of your risk, since they move up and down together on most days.
Do you think these two coins will move more and more alike in the future, or grow further apart?
Data source: Binance public spot daily-candlestick endpoints for XLMUSDT and XRPUSDT, covering May 11 to November 6, 2026 (UTC dates). Data retrieved November 8 at 00:06 Beijing time. Not investment advice.
First, the “pretty similar” part: over those 180 days, the two coins moved in the same direction on 145 days.
Now for the difference. The line in the chart shows how many XRP one XLM could buy at the closing price. It was about 0.114 on May 11, hit a low of around 0.105 on May 20, and then XLM suddenly took off on its own, surging to about 0.205 on June 18—roughly doubling.
After that, it gradually drifted back down. By November 6, the ratio was about 0.130, around 36% below its June peak.
Looking at the whole period, XLM fell from around 0.1696 USDT to about 0.1533, a drop of roughly 9.6%; XRP fell from around 1.4735 to about 1.179, a drop of roughly 20.0%. XLM fell less, largely thanks to its independent rally in May and June.
It also has a more volatile temperament. Based on daily price changes, XLM’s daily volatility was about 4.7%, compared with about 3.1% for XRP.
So “moving in the same direction” doesn’t mean “moving by the same amount.” If you’re thinking of using one spot asset as a substitute for the other, consider whether you can handle it suddenly surging on its own for a while, then slowly giving those gains back. If you trade futures, take note: holding both coins together doesn’t diversify much of your risk, since they move up and down together on most days.
Do you think these two coins will move more and more alike in the future, or grow further apart?
Data source: Binance public spot daily-candlestick endpoints for XLMUSDT and XRPUSDT, covering May 11 to November 6, 2026 (UTC dates). Data retrieved November 8 at 00:06 Beijing time. Not investment advice.