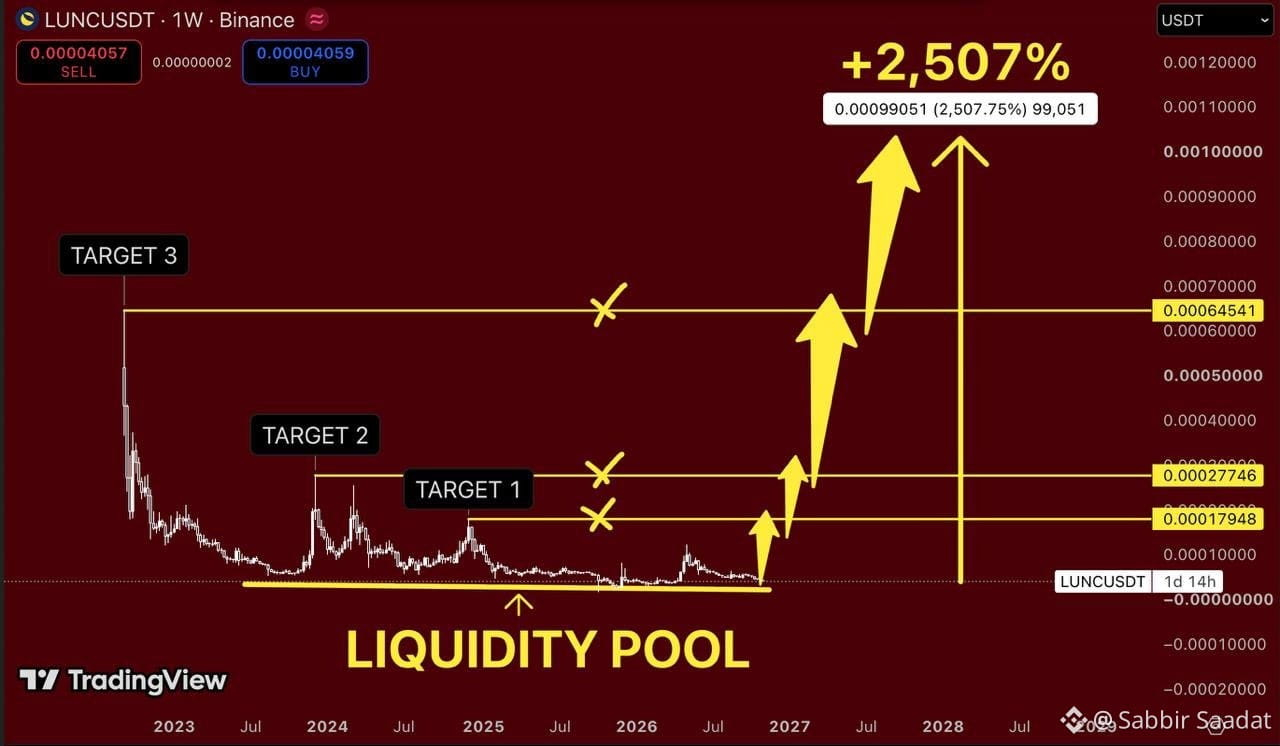

$LUNC at $0.000040 is the kind of chart most traders scroll past without thinking twice.
And I get it.
Years of bleeding. Every rally sold. Every recovery turning into another disappointment.
But here's what caught my attention.
Price has been holding near the same long-term support zone
and the weekly chart is getting incredibly compressed.
If buyers finally step in, $0.00018 is the first major level I'm watching.
Then $0.00028 and $0.00065.
And if the market goes completely crazy, $0.001 becomes my extreme bull case.
That's a potential 2,500%+ move on the chart.
Does that mean it's going to happen? Absolutely not.
But it's funny how everyone wants a 25x until they see what the chart looks like before one.
For now, $LUNC needs to prove this is a real bottom
not just another pause in the downtrend
And I get it.
Years of bleeding. Every rally sold. Every recovery turning into another disappointment.
But here's what caught my attention.
Price has been holding near the same long-term support zone
and the weekly chart is getting incredibly compressed.
If buyers finally step in, $0.00018 is the first major level I'm watching.
Then $0.00028 and $0.00065.
And if the market goes completely crazy, $0.001 becomes my extreme bull case.
That's a potential 2,500%+ move on the chart.
Does that mean it's going to happen? Absolutely not.
But it's funny how everyone wants a 25x until they see what the chart looks like before one.
For now, $LUNC needs to prove this is a real bottom
not just another pause in the downtrend