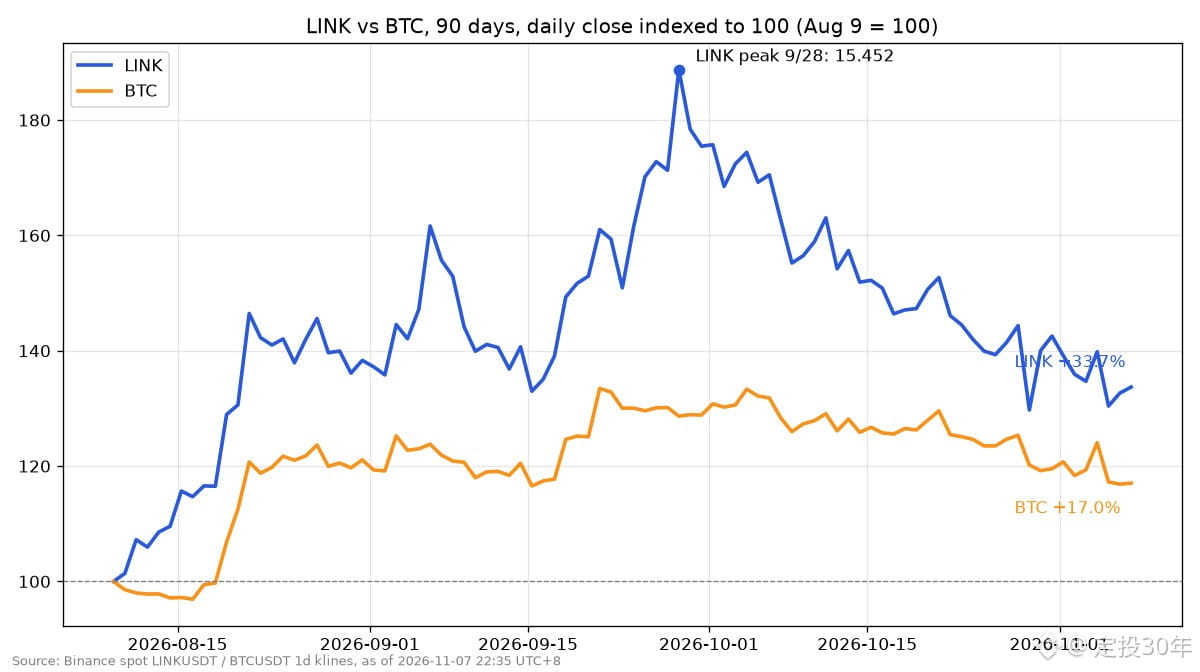
Put $LINK and $BTC on the same chart, both rebased to 100 on August 9, and see which one went farther over these 90 days.
Now for the results: LINK rose from 8.187 to about 10.946 USDT, a gain of roughly 33.7%. Over the same period, BTC rose from about 64,902 to about 75,959, a gain of roughly 17.0%. Looking only at the start and end points, LINK roughly doubled BTC’s performance.
But the middle of the period is what really matters. On September 28, LINK closed at 15.452, equivalent to 188.7 on the chart—almost double its starting point. Since then, it has pulled back about 29.2% from that high. BTC peaked on September 21 at about 86,620 and has since pulled back about 12.3%.
In other words, LINK surged harder on the way up, but also fell further on the way down. The LINK/BTC ratio has dropped about 22.1% from its September 28 peak. Over the past 30 days, LINK is down about 13.9%, compared with about 7.1% for BTC—roughly twice the decline.
Trading volume is also cooling off. During the first 30 days of this 90-day period, LINK’s average daily spot trading volume was about $32.59 million. In the most recent 30 days, it fell to about $22.72 million, down roughly 30%.
If you hold spot, here’s something to think about: if you simply held through these 90 days, your portfolio looks pretty good on paper. But if you bought in around the highs in late September, you’re probably still down nearly 30%. It’s the same coin, but the experience can be completely different depending on when you got in.
What matters more to you: the total gain over 90 days, or how quickly it pulled back from its high?
Data from Binance’s public daily candlestick API for LINKUSDT and BTCUSDT spot markets, as of November 7 at 22:35 (Beijing time). The daily candle has not closed. Not investment advice.
Now for the results: LINK rose from 8.187 to about 10.946 USDT, a gain of roughly 33.7%. Over the same period, BTC rose from about 64,902 to about 75,959, a gain of roughly 17.0%. Looking only at the start and end points, LINK roughly doubled BTC’s performance.
But the middle of the period is what really matters. On September 28, LINK closed at 15.452, equivalent to 188.7 on the chart—almost double its starting point. Since then, it has pulled back about 29.2% from that high. BTC peaked on September 21 at about 86,620 and has since pulled back about 12.3%.
In other words, LINK surged harder on the way up, but also fell further on the way down. The LINK/BTC ratio has dropped about 22.1% from its September 28 peak. Over the past 30 days, LINK is down about 13.9%, compared with about 7.1% for BTC—roughly twice the decline.
Trading volume is also cooling off. During the first 30 days of this 90-day period, LINK’s average daily spot trading volume was about $32.59 million. In the most recent 30 days, it fell to about $22.72 million, down roughly 30%.
If you hold spot, here’s something to think about: if you simply held through these 90 days, your portfolio looks pretty good on paper. But if you bought in around the highs in late September, you’re probably still down nearly 30%. It’s the same coin, but the experience can be completely different depending on when you got in.
What matters more to you: the total gain over 90 days, or how quickly it pulled back from its high?
Data from Binance’s public daily candlestick API for LINKUSDT and BTCUSDT spot markets, as of November 7 at 22:35 (Beijing time). The daily candle has not closed. Not investment advice.