Solana $SOL on November 7: weak rebound under technical pressure
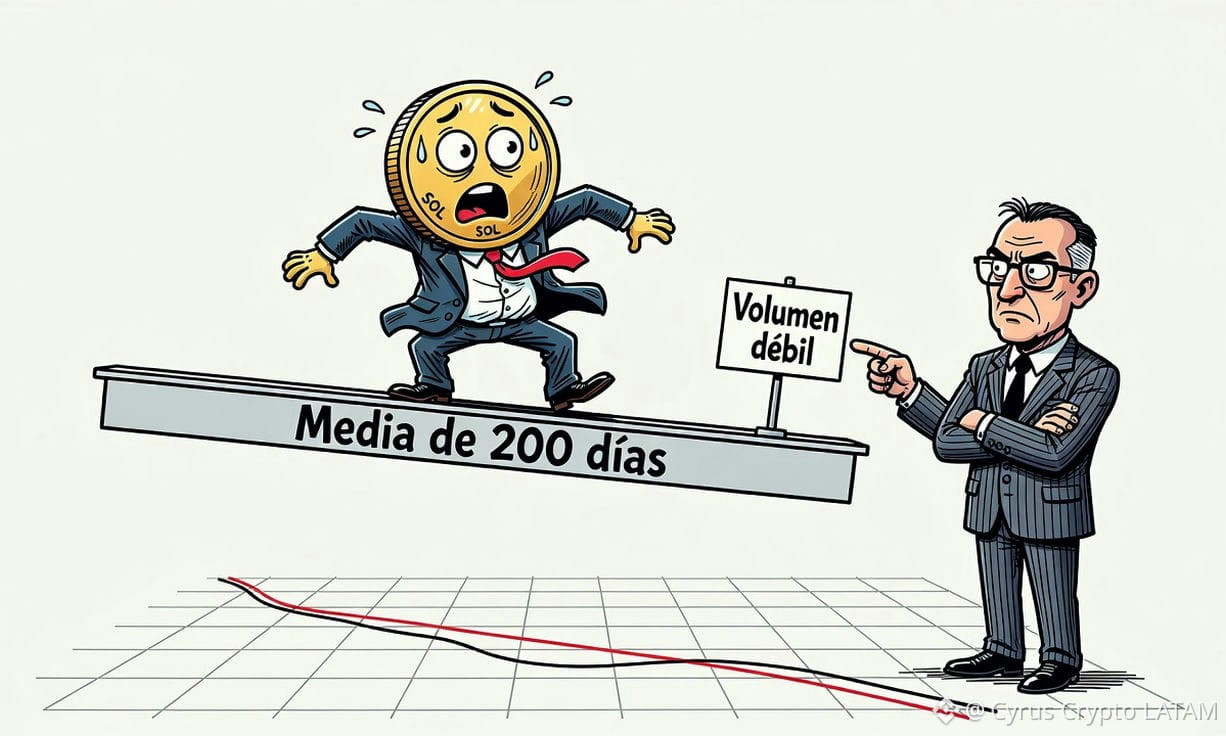
SOL is trading at USD $89.94 and has posted a reported daily gain of 0.63%, just above its SMA-200. However, weakness in the shorter-term moving averages, a bearish MACD, and below-average volume keep risk elevated: the signal is caution, not a confirmed reversal.
The range recorded during the session, between USD $89.67 and USD $90.25, describes a limited move up to that point. The data do not identify a confirmed catalyst for this change, so it is more accurate to describe it as a modest advance amid weakness than as a proven recovery.
#solana is a smart contract network whose native asset, SOL, is used for protocol operations and in applications across its ecosystem. This utility may support demand if there is actual activity, but the available information provides no figures on transactions, active users, fees, protocol revenue, or total value locked.
Recommendation: HOLD, with a defensive bias. The methodology uses five observable signals: price structure relative to moving averages, MACD, RSI, relative volume, and position relative to the SMA-200. Three signals are unfavorable—price below most moving averages, bearish MACD, and below-average volume—one is mixed—RSI near oversold—and one offers limited support—price still above the SMA-200. The net signal does not justify an aggressive buy or an automatic sell at this level.
In the short term, traders may wait for a recovery above USD $90.25 before considering a position, with invalidation below USD $89.67 or a stop adjusted to their strategy and the ATR of USD $3.94. The initial take-profit zone could be set around USD $91.47, with a second test at USD $93.26–USD $93.45 only if momentum continues. These levels are technical reference points, not guarantees, and position size should be adjusted so that an adverse exit does not exceed the planned risk.
SOL is trading at USD $89.94 and has posted a reported daily gain of 0.63%, just above its SMA-200. However, weakness in the shorter-term moving averages, a bearish MACD, and below-average volume keep risk elevated: the signal is caution, not a confirmed reversal.
The range recorded during the session, between USD $89.67 and USD $90.25, describes a limited move up to that point. The data do not identify a confirmed catalyst for this change, so it is more accurate to describe it as a modest advance amid weakness than as a proven recovery.
#solana is a smart contract network whose native asset, SOL, is used for protocol operations and in applications across its ecosystem. This utility may support demand if there is actual activity, but the available information provides no figures on transactions, active users, fees, protocol revenue, or total value locked.
Recommendation: HOLD, with a defensive bias. The methodology uses five observable signals: price structure relative to moving averages, MACD, RSI, relative volume, and position relative to the SMA-200. Three signals are unfavorable—price below most moving averages, bearish MACD, and below-average volume—one is mixed—RSI near oversold—and one offers limited support—price still above the SMA-200. The net signal does not justify an aggressive buy or an automatic sell at this level.
In the short term, traders may wait for a recovery above USD $90.25 before considering a position, with invalidation below USD $89.67 or a stop adjusted to their strategy and the ATR of USD $3.94. The initial take-profit zone could be set around USD $91.47, with a second test at USD $93.26–USD $93.45 only if momentum continues. These levels are technical reference points, not guarantees, and position size should be adjusted so that an adverse exit does not exceed the planned risk.