THE BOUNCE IS FADING — CAN LINEA REBUILD MOMENTUM?
$LINEA 4H Chart Study | November 7, 2026
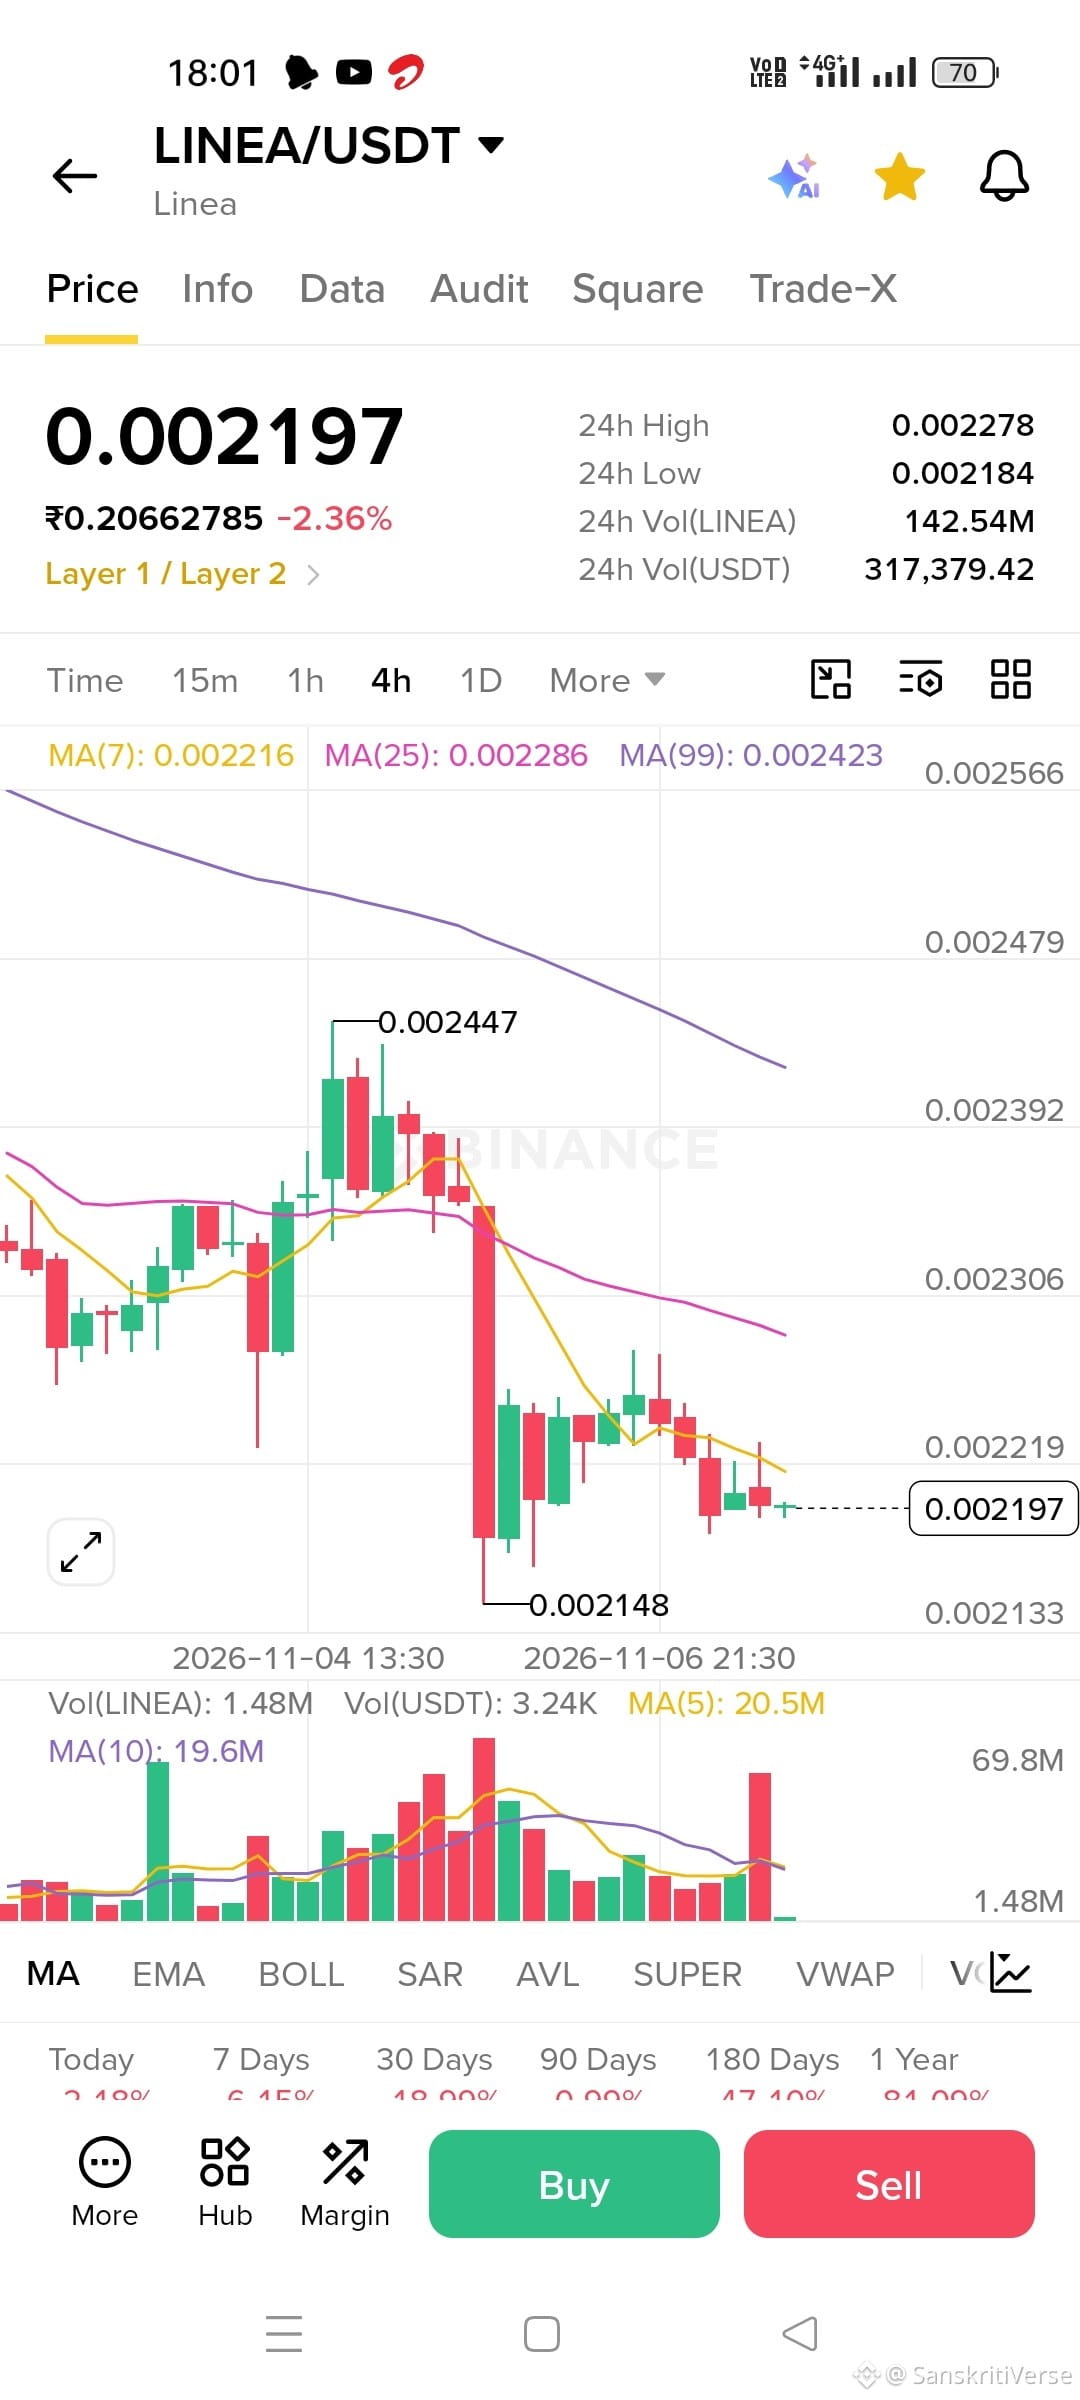
In this screenshot, LINEA showed a small recovery after touching the visible $0.002148 low. Price is now near $0.002197, but remains below the three moving averages shown on the chart.
What I’m observing:
MA(7): $0.002216
MA(25): $0.002286
MA(99): $0.002423
Price is still below all three moving averages.
The recent recovery has not yet formed a stronger upward structure in this 4H view.
Areas visible on this chart:
The $0.002216–$0.002286 region overlaps with nearby short-term moving-average levels.
The $0.002148–$0.002184 region includes the recent low and nearby price activity.
What this chart study highlights:
If price can move back above the shorter-term averages and remain there after a 4H close, the recovery structure may look stronger.
If price remains below these averages and selling activity increases near the recent low, short-term weakness may remain visible.
If the current 4H candle is still open, the displayed setup can change before it closes.
Beginner learning:
A bounce from a recent low is a price reaction—not confirmation of a broader trend reversal. Moving averages, candle closes, and trading activity can help provide more context.
This is a screenshot-based educational observation, not a live trading signal or financial advice.
When reviewing a recovery, do you focus first on moving-average structure or the latest candle close?
$LINEA
#LINEA #ChartAnalysis #CryptoEducation #TechnicalAnalysis #LearnInPublic
$LINEA 4H Chart Study | November 7, 2026
In this screenshot, LINEA showed a small recovery after touching the visible $0.002148 low. Price is now near $0.002197, but remains below the three moving averages shown on the chart.
What I’m observing:
MA(7): $0.002216
MA(25): $0.002286
MA(99): $0.002423
Price is still below all three moving averages.
The recent recovery has not yet formed a stronger upward structure in this 4H view.
Areas visible on this chart:
The $0.002216–$0.002286 region overlaps with nearby short-term moving-average levels.
The $0.002148–$0.002184 region includes the recent low and nearby price activity.
What this chart study highlights:
If price can move back above the shorter-term averages and remain there after a 4H close, the recovery structure may look stronger.
If price remains below these averages and selling activity increases near the recent low, short-term weakness may remain visible.
If the current 4H candle is still open, the displayed setup can change before it closes.
Beginner learning:
A bounce from a recent low is a price reaction—not confirmation of a broader trend reversal. Moving averages, candle closes, and trading activity can help provide more context.
This is a screenshot-based educational observation, not a live trading signal or financial advice.
When reviewing a recovery, do you focus first on moving-average structure or the latest candle close?
$LINEA
#LINEA #ChartAnalysis #CryptoEducation #TechnicalAnalysis #LearnInPublic