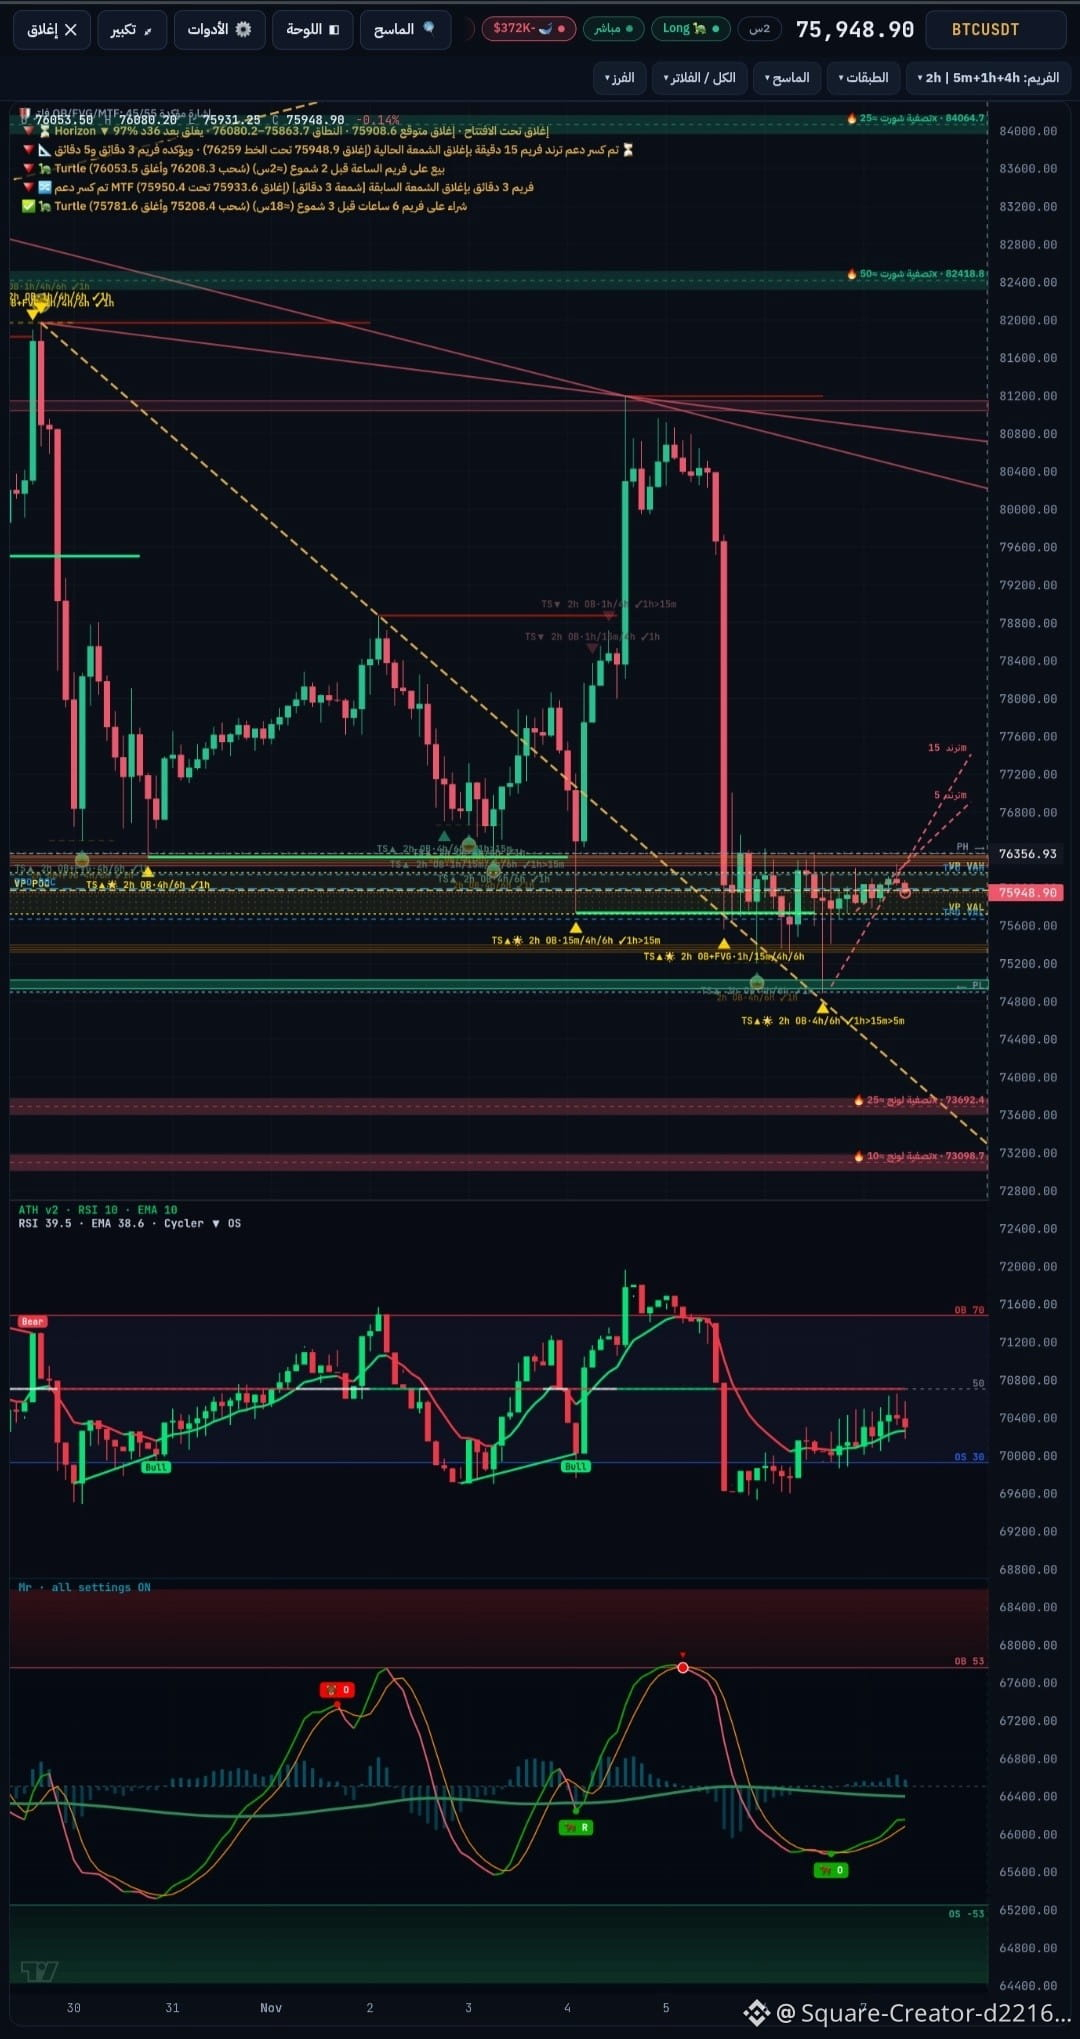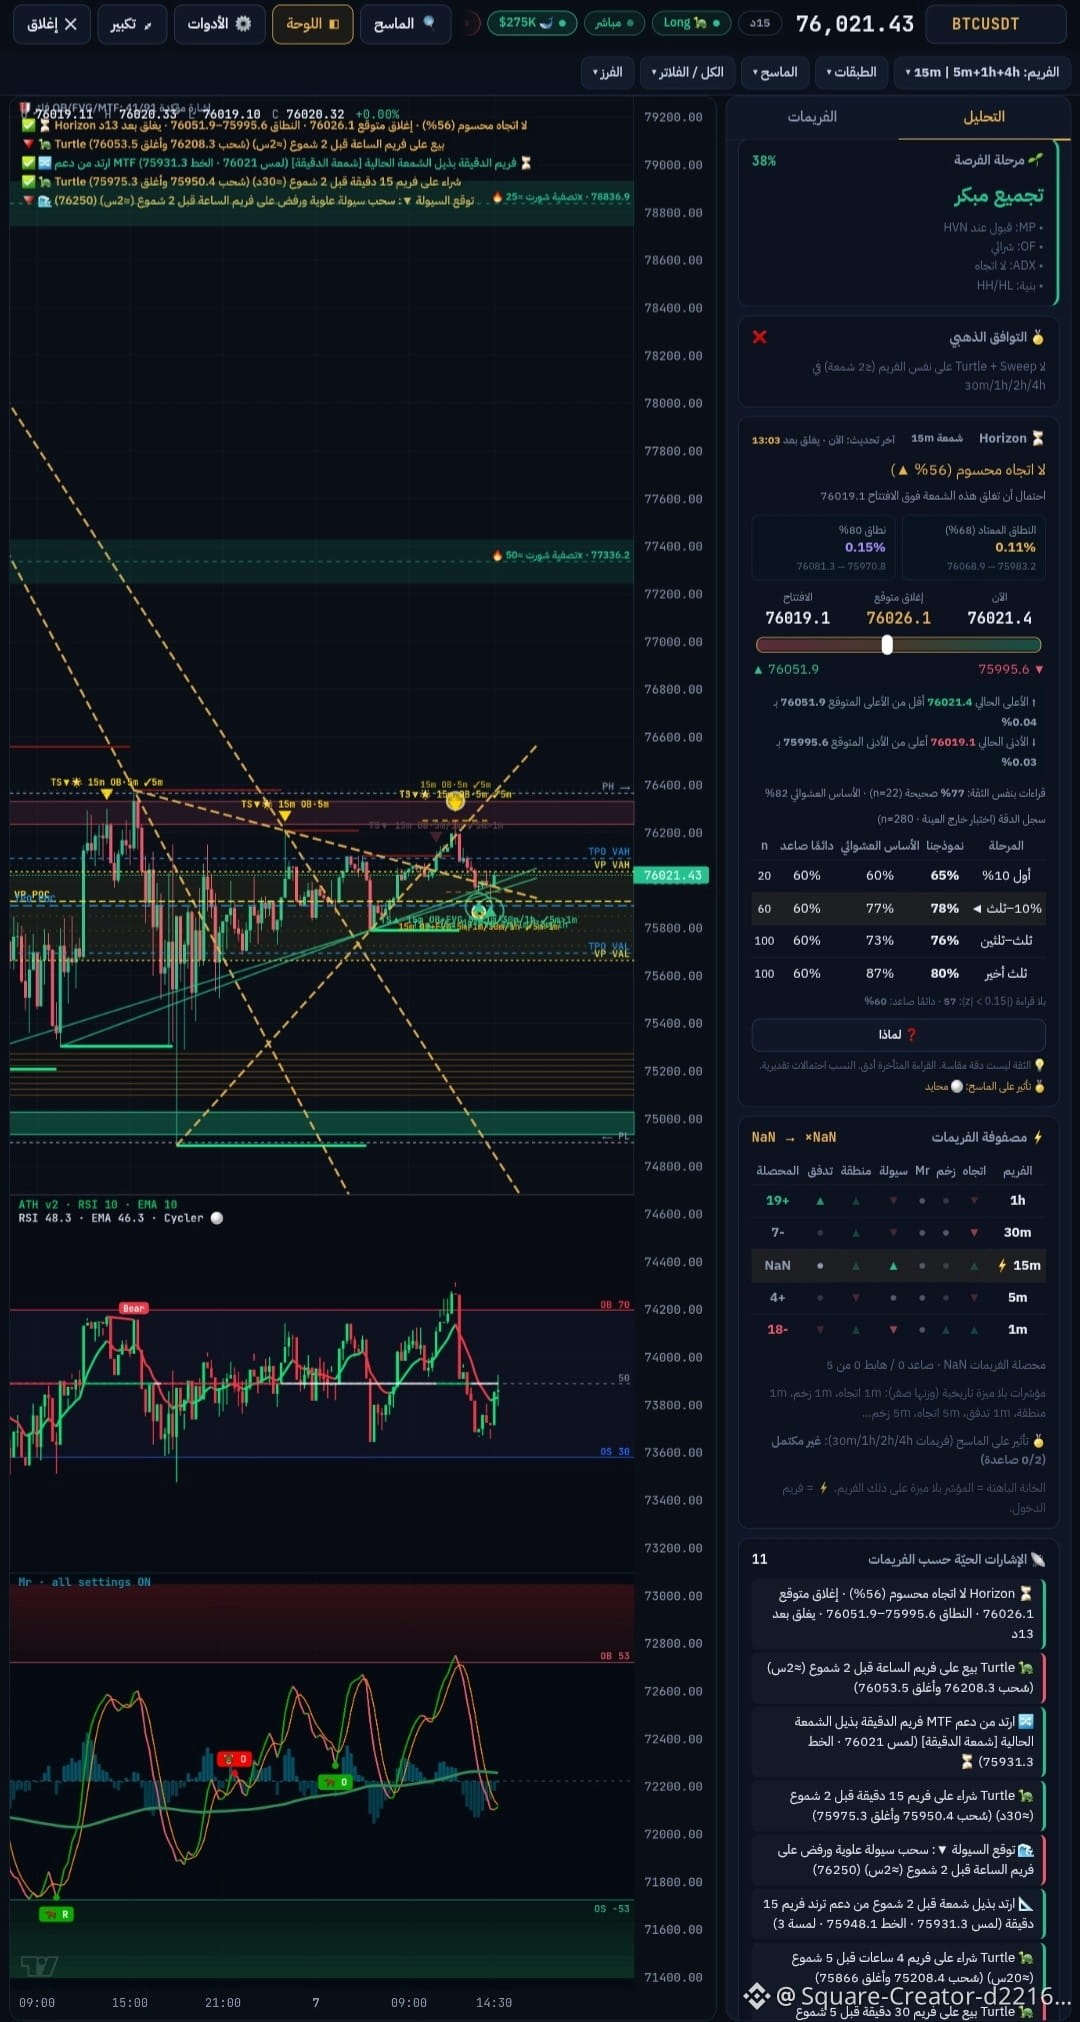
What we’re seeing on the lower time frame is a bounce from 76,300–76,600, a key resistance zone for regaining momentum.
On the positive side, holding above the current support zone and breaking above 76,600 dollars could open the way for a test of 77,600–78,000.
The zone could turn from resistance into support.
This area represents nearby resistance, and we can see that the price may bounce off it on a retest. This means buyers have not yet managed to establish a clear breakout and hold above it.
Repeated rejection from this zone, combined with weaker rebounds, keeps the possibility of a return to test 75,500–75,200 on the table.
$BTC
On the positive side, holding above the current support zone and breaking above 76,600 dollars could open the way for a test of 77,600–78,000.
The zone could turn from resistance into support.
This area represents nearby resistance, and we can see that the price may bounce off it on a retest. This means buyers have not yet managed to establish a clear breakout and hold above it.
Repeated rejection from this zone, combined with weaker rebounds, keeps the possibility of a return to test 75,500–75,200 on the table.
$BTC